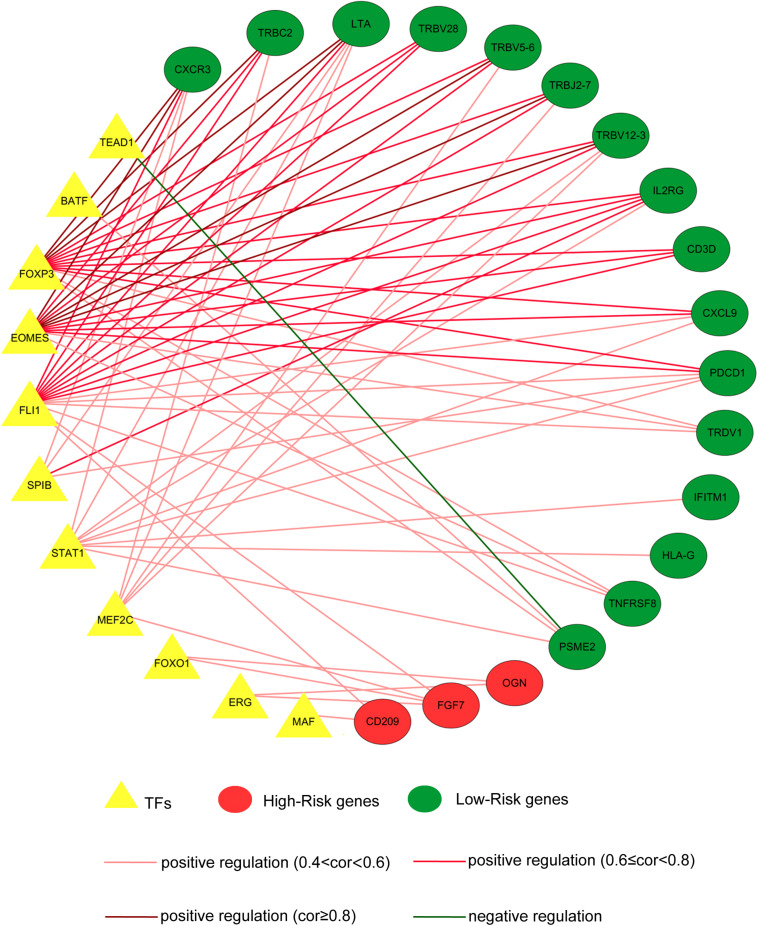
FIGURE 3.
The transcription factor–prognostic immune-related differentially expressed gene (TF–PIRDEG) regulatory network in breast cancer (BRCA). The red circles indicate high-risk genes, and the green circles indicate low-risk genes. The yellow triangles indicate the TFs, and the green line indicates a negative correlation. The light red lines, red lines, and dark red lines indicate positive correlations with correlation coefficients of 0.4–0.6, 0.6–0.8, and higher than 0.8, respectively.

