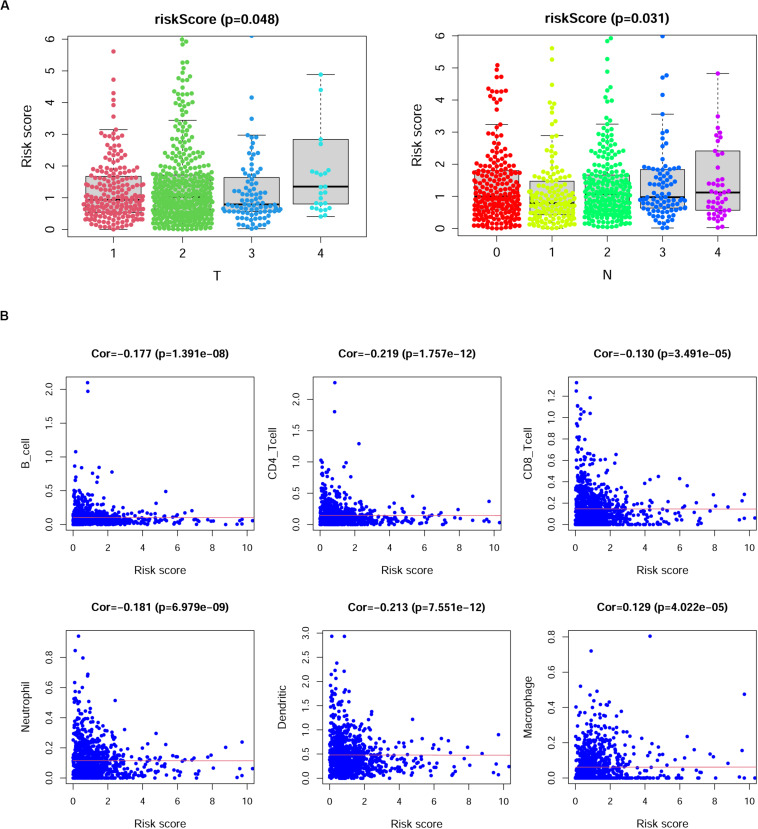
FIGURE 7.
The correlation between risk scores and clinical characteristics of breast cancer (BRCA) patients. (A) Risk scores showed differences among different tumor depth groups and lymph node invasion groups. T, tumor depth; N, lymph node invasion. Kruskal–Wallis test. (B) The correlation between risk scores and the numbers of six types of immune cells in patients with BRCA. Cor., Spearman correlation coefficient.

