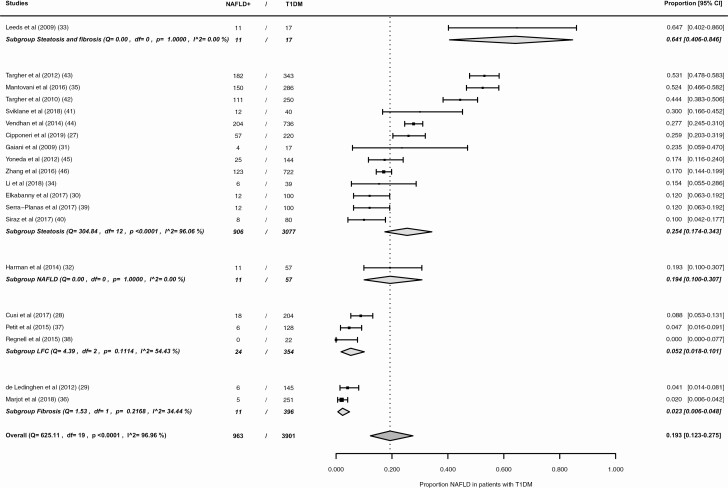
Figure 5.
Forest plot NAFLD prevalence in patients with type 1 diabetes, subgroups according to NAFLD definition: (1) steatosis and fibrosis, (2) steatosis, (3) NAFLD, (4) LFC, (5) fibrosis. NAFLD+, patients with nonalcoholic fatty liver disease; T1DM, type 1 diabetes mellitus; LFC, liver fat content.

