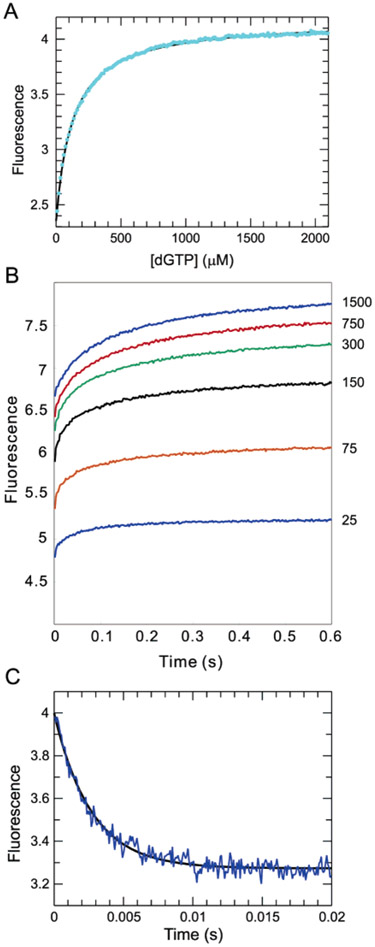
Figure 4:
Equilibrium and kinetics of the fluorescence changes following incorrect nucleotide binding. (A) Equilibrium titration data follow a hyperbolic curve with a Kd of 130 ± 0.8 μM. (B) Stopped-flow fluorescence traces corresponding to the binding of dGTP at concentrations ranging from 25 to 1500 μM. The data could be fitted globally with three isomerization steps with forward/ reverse rates of 220/420, 30/100, and 12/7, respectively, but this fit is not unique and is not shown. Rather, the minimal model with a single isomerization is shown in Scheme 1. (C) Rate of nucleotide release from a mismatched ternary complex was measured by chasing the release of the mismatch with the correct nucleotide. The E•DNAdd•dGTP complex (200 nM) was formed with 250 μM dGTP and then mixed with 2 mM dCTP. The fluorescence transition shows a single-exponential decay with a rate of 372 ± 5.4 s−1.

