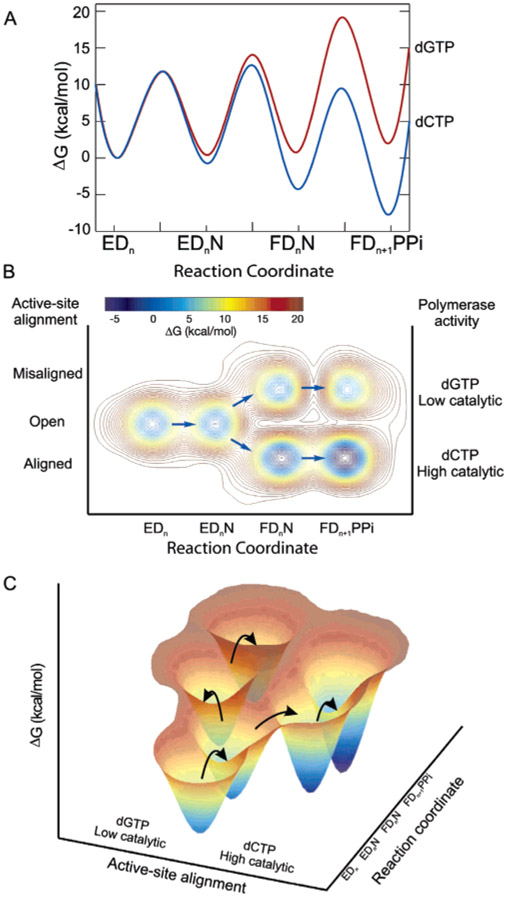
Figure 5:
Free-energy profiles for the T7 DNA polymerase. (A) Conventional free-energy diagram for correct (dCTP) and mismatched (dGTP) nucleotide incorporation reactions. The free energy was calculated as ΔG‡ = RT[ln(kT/h) − ln(kobs)] kcal/mol using rate constants from Scheme 1. The constant k is the Boltzmann constant, T is 293 K, h is Planck’s constant, and kobs is the firstorder rate constant. The nucleotide concentration was set equal to 100 μM. (B) Proposed three-dimensional free-energy diagram taking conclusions from our fluorescence studies into account. The diagram includes the alignment of active-site residues as a third axis. (C) Three-dimensional presentation of our proposed reaction free-energy profile for correct and incorrect nucleotide incorporations.

