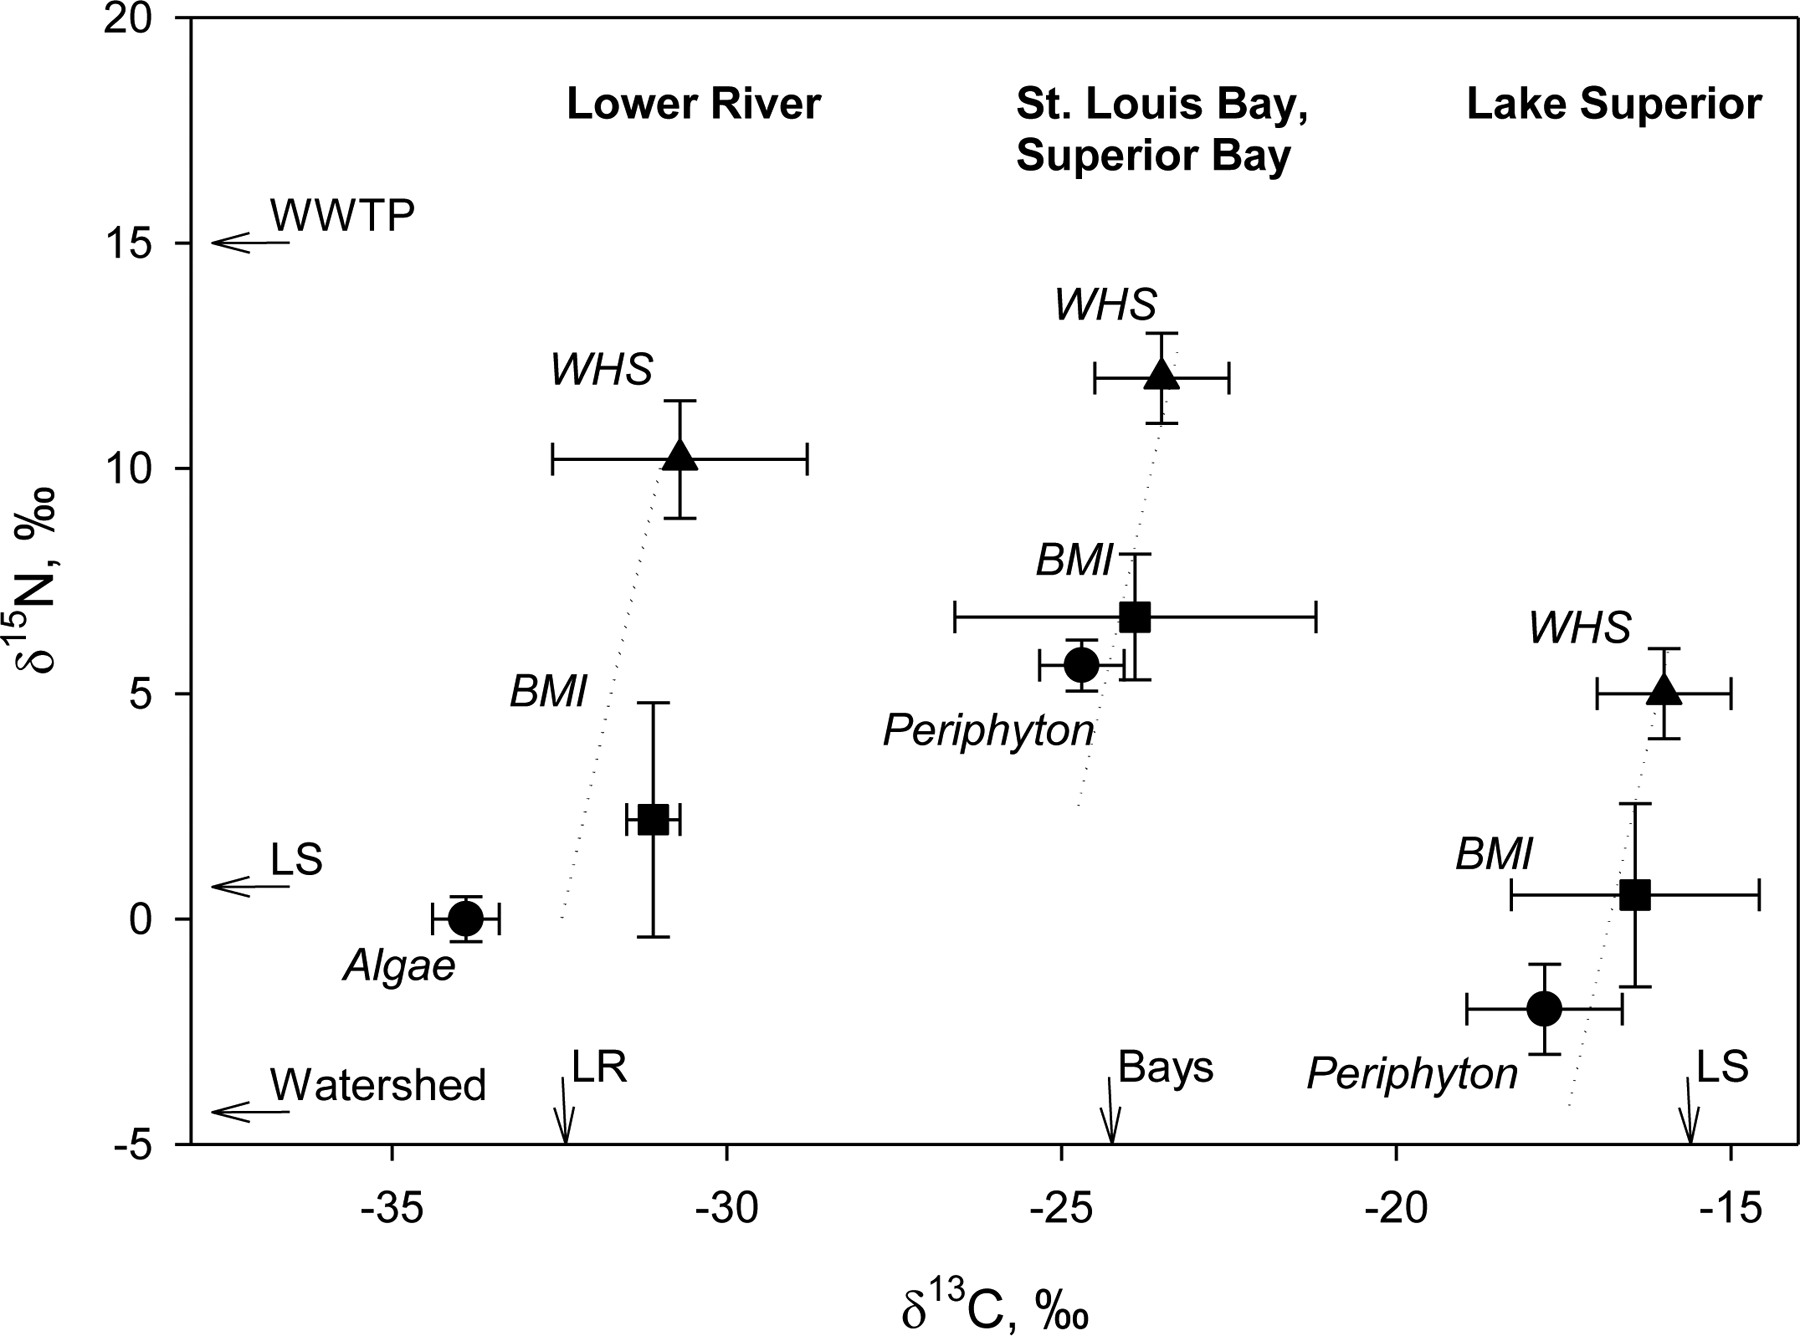
Figure 2.

Food web δ13C and δ15N values for the Lower River, St. Louis Bay and Lake Superior Bay (Bays), and Lake Superior (LS). Food web compartments include dissolved inorganic carbon δ13C values by site (indicated by arrows, based on an isotopic fractionation of −21‰ for algae and −14‰ for periphyton; Hoffman et al., 2015a), nitrate δ15N values by source (indicated by arrows, WS: watershed; WWTP: wastewater treatment plant; Hoffman et al., 2012), primary producers (algae, periphyton; Hoffman et al., 2015a), benthic macroinvertebrates (BMI, a mix of sediment-dwelling invertebrates, including mayfly nymphs [Family: Hexagenia] and midge larvae [Family: Chironomidae]; Hoffman et al., 2012), and putative “resident” white sucker (WHS; Blazer et al., 2014a). Dashed lines indicate three trophic levels of isotopic fractionation (+0.4‰ δ13C, +3.4‰ δ15N per trophic level; Vander Zanden and Rasmussen, 2001).
