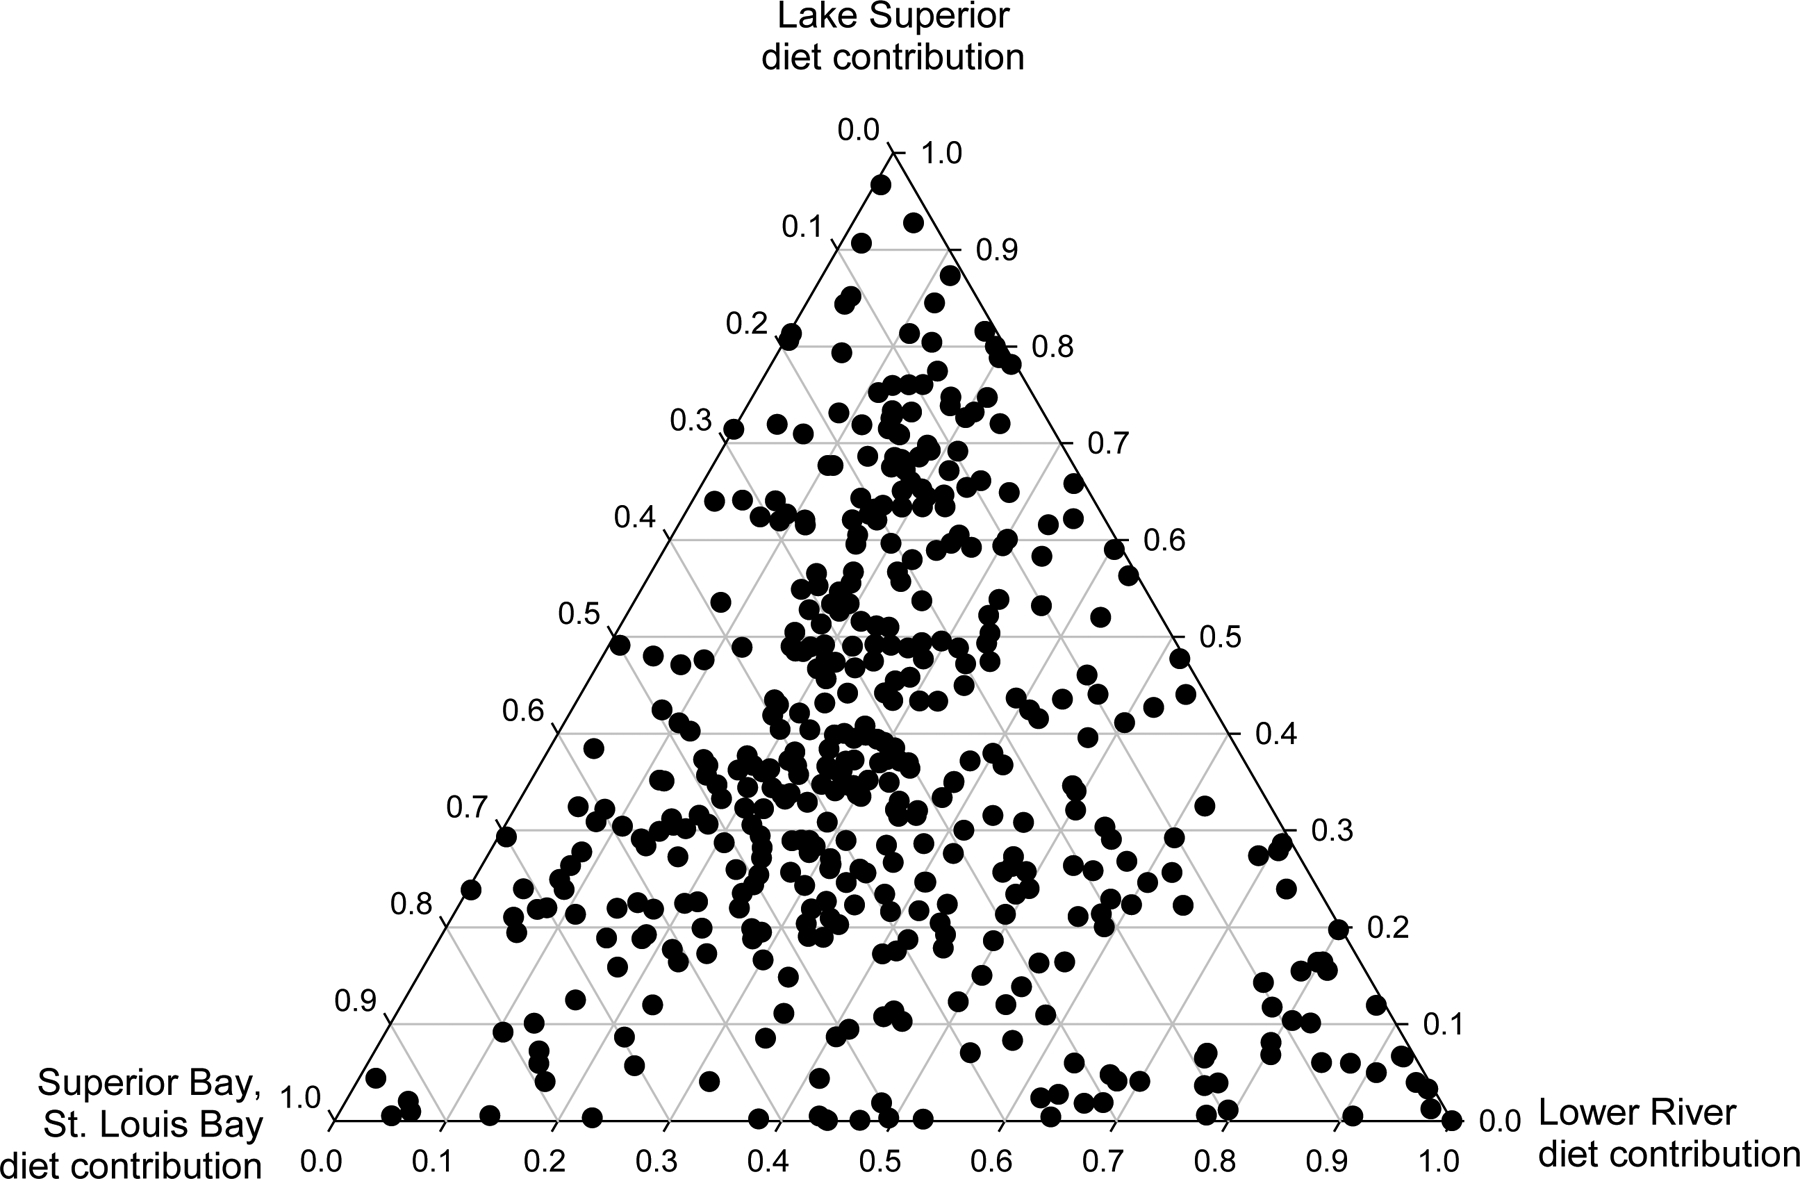
Figure 6.

Diet contribution estimates from the stable isotope mixing model for white sucker captured below Fond du Lac Dam from 2011 through 2015. Each point represents the estimate for an individual fish (n = 619); white suckers in the upper triangle have a 100% diet contribution from Lake Superior (i.e., Lake Superior diet contribution = 1.0), those in the lower left triangle a 100% diet contribution from Superior Bay and St. Louis Bay, and those in the lower right triangle a 100% diet contribution from the Lower river.
