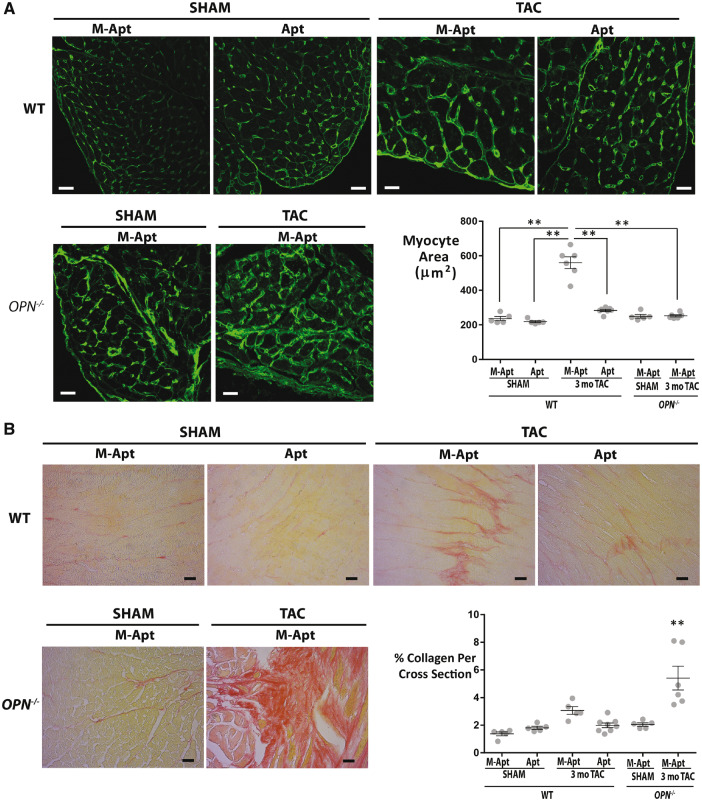
Figure 6.
OPN aptamer reverses myocyte hypertrophy and fibrosis in wild type TAC hearts, and OPN-/- late TAC hearts show excessive fibrosis. (A) Representative images of Wheat Germ Agglutinin staining and corresponding myocyte area in heart cross sections at 3 month post-Sham (N = 5 mice per group) or TAC (N = 6–7 mice per group) in wild type and OPN-/- mice. Scale bar = 20μm. **P ≤ 0.01. (B) Representative images of Picrosirius Red staining and corresponding % collagen content in heart cross sections at 3 month post-Sham (N = 5 mice per group) or TAC (N = 5–8 mice per group) in wild type and OPN-/- mice. Scale bar = 20 μm. **P ≤0.01 relative to each of the other five groups. Error bars = SEM. P-values are from ANOVA with Tukey multiple correction. WT, wild type; TAC, Transverse Aortic Constriction; Apt, OPN aptamer; M-Apt, Mutant aptamer.

