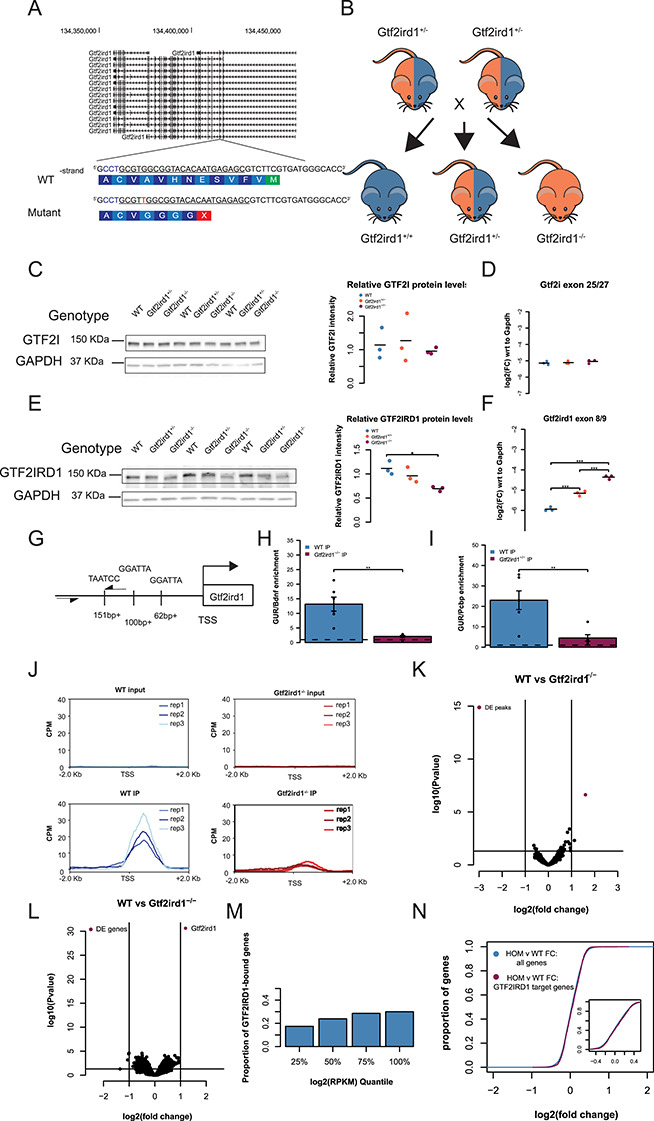
Figure 4.

Frameshift mutation in Gtf2ird1 exon 3 results in a decreased amount of an N-truncated protein with diminished binding at Gtf2ird1 promoter and has a little effect on transcription in the brain. (A) The sequence of exon 3 of Gtf2ird1 targeted by the underlined gRNA with the PAM sequence in blue. The mutant allele contains a one base pair insertion of an adenine nucleotide that results in a premature stop codon. (B) Breeding scheme of the intercross of Gtf2ird1+/− to produce genotypes used in the experiments. (C, D) Mutation in Gtf2ird1 does not affect the protein or transcript levels of Gtf2i. (E) Frameshift mutation decreases the amount of protein in Gtf2ird1−/− and causes a slight shift to lower molecular weight. (F) The abundance of Gtf2ird1 transcript increases with increasing dose of the mutation. (G) Schematic of Gtf2ird1 upstream regulatory element (GUR) that shows the three GTF2IRD1 binding motifs. The arrows indicate the location of the primers for amplifying the GUR in the ChIP-qPCR assay. (H, I) WT ChIP of GTF2IRD1 shows enrichment of the GUR over off-target regions. There is more enrichment in the WT genotype compared to the Gtf2ird1−/− genotype. (J) Profile plots of GTF2IRD1 ChIP-seq data confirm diminished binding at the Gtf2ird1 promoter. (K) Differential peak analysis comparing WT and Gtf2ird1−/− ChIP-seq data showed only the peak at Gtf2ird1 is changed between genotypes with an FDR < 0.1. (L) Differential expression analysis in the E13.5 brain comparing WT and Gtf2ird1−/− showed only Gtf2ird1 as changed with FDR < 0.1. (M) The presence of GTF2IRD1 at gene promoters is not evenly distributed across expression levels. (N) The expression of genes bound by GTF2IRD1 is not different compared to all other genes between WT and Gtf2ird1−/− mutants. *p < 0.05, **p < 0.01, ***p < 0.001.
