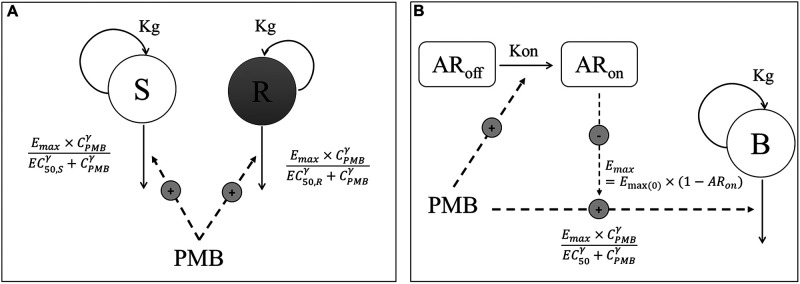
FIG 1.
Schematic illustrations of the S/R model (A) and AR model (B). CPMB, PMB concentration; S, compartment with PMB-sensitive bacteria; R, compartment with resistant bacteria; B, compartment with homogenous bacterial population; Kg, rate constant for multiplication of bacteria; Emax, maximum kill rate constant; Emax(0), maximum kill rate constant when no adaptive resistance has developed; EC50, PMB concentration producing 50% of Emax(0); EC50,S and EC50,R, PMB concentration producing 50% of Emax for (S) and (R) bacteria, respectively; γ, sigmoidicity factor; ARoff and ARon, compartments describing adaptive resistance being off and on, respectively; Kon, rate constant for development of adaptive resistance.

