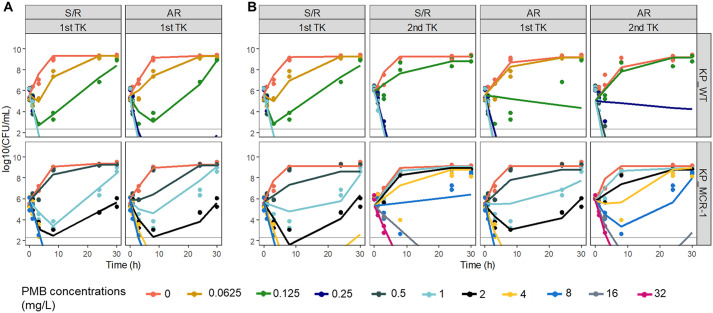
FIG 2.
Comparison of predictions from the S/R and AR models after analysis of a single TK experiment (A) or after simultaneous analysis of the sequential TK data (B) for 2 isogenic isolates. (Top) K. pneumonia R2292 (KP_WT); (bottom) its MCR-1 transconjugant (KP_MCR-1). For KP_WT, PMB concentrations ranging from 0.0625 to 1 mg/liter were used for the 2 sequential TK experiments. For KP_MCR-1, PMB concentrations ranging from 0.5 to 8 and 1 to 32 mg/liter were used for the first and second TK experiments, respectively. Symbols, experimental data (n = 2); color-matched lines, model predictions; gray solid lines, limit of quantification.

