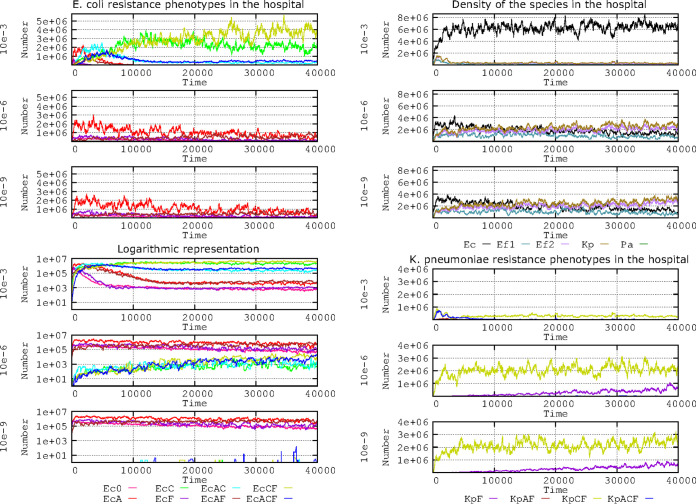
FIG 1.
Influence of plasmid conjugation frequency (10−3, 10−6, 10−9) on the evolution of E. coli resistance phenotypes in the hospital. (Top left) Ec0, susceptible, no resistance plasmids (pink line); EcA, PL1-AbAR (red); EcC, PL3-AbAR-AbCR (light fluorescent green); EcF, AbF*R (violet); EcAC, PL1-AbAR plus PL3-AbAR-AbCR (light blue); EcAF, PL1-AbAR plus AbF*R (brown); EcCF, PL3, AbAR-AbCR plus AbF*R (olive green); EcACF, PL1-AbAR plus PL3-AbAR-AbCR plus AbF*R (dark blue). (Lower left) A logarithmic representation of the same resistance phenotypes. (Top right) Density of the species E. coli (black line), K. pneumoniae (olive green), ampicillin-resistant E. faecium (violet), and ampicillin-susceptible E. faecium (blue green). (Lower right) Detail of the evolution of K. pneumoniae (olive green) and ampicillin-resistant E. faecium (violet). Numbers in ordinates are expressed in hecto-cells (one unit = 100 cells in the microbiota). Note that the spread of populations with plasmid-mediated resistance correlates with plasmid conjugation frequency, and the effect is not visible with very low conjugation frequencies.

