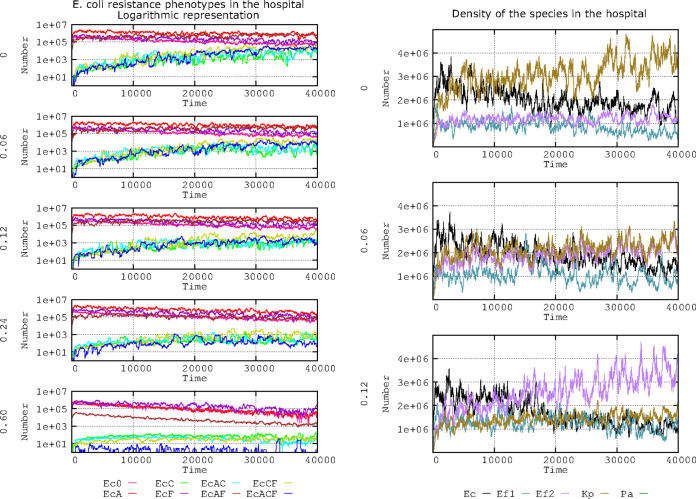
FIG 4.
Influence of plasmid fitness cost on the evolution of E. coli antibiotic resistance phenotypes. The graphs in the left column show the effects for each fitness cost (0, 0.06, 0.12, 0.24, and 0.60). The lines indicate the following. Ec0, susceptible, no resistance plasmids (pink line). On the left, effects of no fitness cost (0), and 0.06, 0.12, 0.24, and 0.6 fitness costs. Ec0, susceptible, no resistance plasmids (pink line); EcA, PL1-AbAR (red); EcC, PL3-AbAR-AbCR (light fluorescent green); EcF, AbF*R (violet); EcAC, PL1-AbAR plus PL3-AbAR-AbCR (light blue); EcAF, PL1-AbAR plus AbF*R (brown); EcCF, PL3, AbAR-AbCR plus AbF*R (olive green); EcACF, PL1-AbAR plus PL3-AbAR-AbCR plus AbF*R (dark blue). The graphs in the right column show the influence of 3 fitness costs (0.0, 0.06, 0.12) on the species distribution in the simulated ecosystem as follows: E. coli (black line), K. pneumoniae (dark olive green), ampicillin-resistant E. faecium (violet), ampicillin-susceptible E. faecium (blue-green). Numbers in ordinates are expressed in hecto-cells (one unit = 100 cells in the microbiota). In the left column, note that the increase in plasmid fitness cost reduces the spread of multiresistant phenotypes, but costs below 0.12 have a small effect. In the right column, plasmid costs equal or superior to 0.06 produce a reduction in the frequency of K. pneumoniae.

