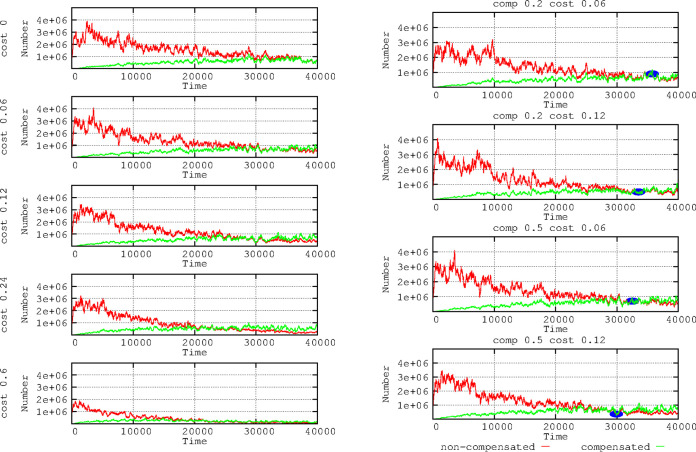
FIG 7.
Effects of plasmid compensation depending on the plasmid fitness cost. In the left column, no compensated E. coli cells for plasmid fitness cost (green) versus compensated cells (red). In the right column, combinations of 2 fitness cost values (0.06 and 0.12) with 2 strength of compensation values (0.2 and 0.5). Small blue ovals highlight that when the plasmid cost is higher, the compensation is more effective (bacteria with compensated plasmids overcome the noncompensated). Numbers in ordinates are expressed in hecto-cells (one unit = 100 cells in the microbiota). Note that the higher the plasmid cost, the earlier cells with compensatory mutations overcome the noncompensated ones.

