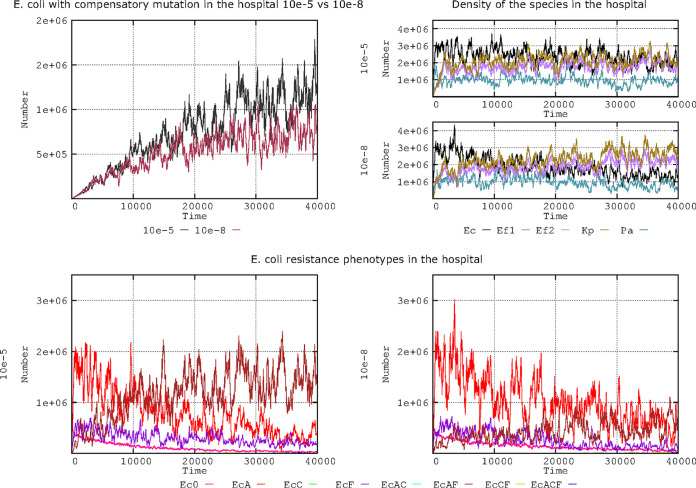
FIG 8.
Compensation of plasmid fitness costs and frequency for fluoroquinolone resistance mutation. (Top left) E. coli cells compensated for fitness costs when mutation frequencies for fluoroquinolone resistance are 10−8 (black) or 10−5 (brown-violet). (Top right) The effect of these mutation frequencies on species distribution (E. coli [black line], K. pneumoniae [olive green], ampicillin-resistant E. faecium [violet], ampicillin-susceptible E. faecium [blue-green]). (Bottom) Evolution of E. coli antibiotic resistance phenotypes at fluoroquinolone mutation frequencies of 10−5 (left) and 10−8 (right). Note that at 10−5, the population combining PL1 (AbAR) (brown) maintains at long term a higher number of cells than the population with only PL1 (red) or AbF*R (violet). Numbers are expressed in hecto-cells (one unit = 100 cells in the microbiota). Note that increased mutation frequencies leading to more frequent fluoroquinolone resistance results in an increase of E. coli with cost-compensated plasmids, and both factors contribute to a long-term increase in E. coli populations.

