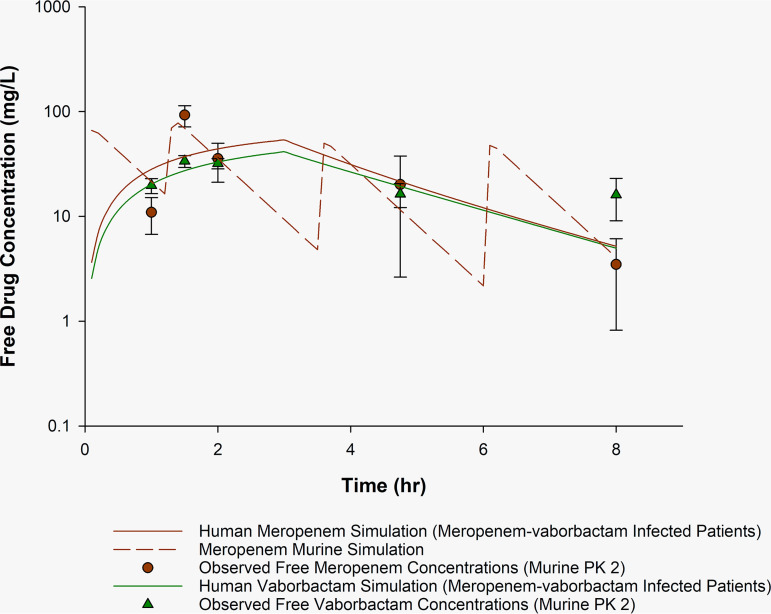
FIG 2.
Observed meropenem and vaborbactam murine concentration-time profile compared with human simulation PK2. Observed concentrations of free meropenem and vaborbactam in the neutropenic murine thigh infection model receiving meropenem-vaborbactam 65/10.8 mg/kg at 0 and 1.25 h, 55/6 mg/kg at 3.5 h, and 50/4 mg/kg at 6 h. Plasma sampling occurred at 1, 1.5, 2, 4.75, and 8 h. Solid lines, simulated human meropenem (red) and vaborbactam (green) concentrations derived from infected patients in the phase 3 meropenem-vaborbactam trials. Dashed line (red), murine-simulated exposure of meropenem and vaborbactam. Circles (red) and triangles (green), observed murine meropenem and vaborbactam concentrations (means ± SD), respectively.

