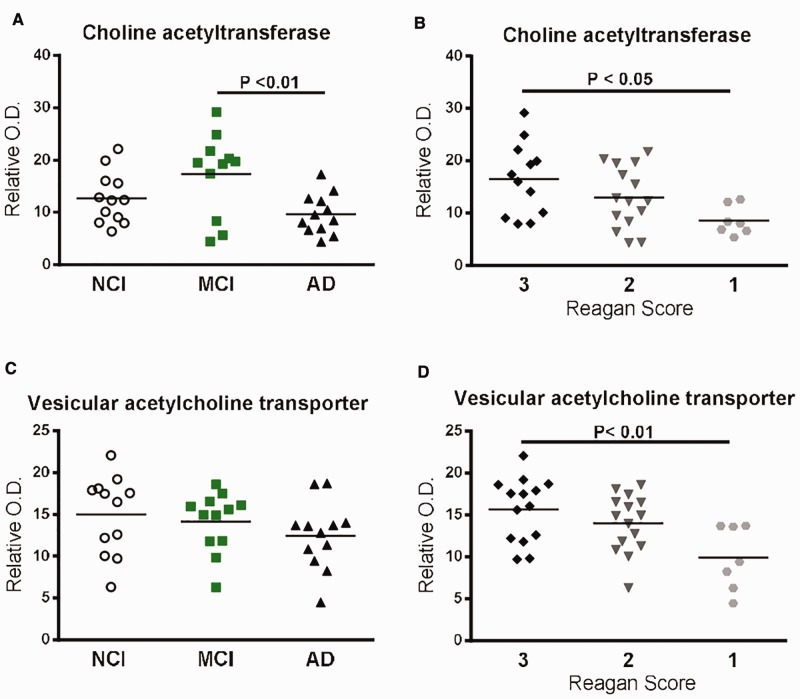
FIGURE 5.
Protein levels of cholinergic markers based on cognitive scores (NCI, MCI or AD), or Reagan score (3,2,1) and correlations with pathological markers.(A, B) ChAT protein levels (Western blot) in detergent-soluble fractions from parietal cortices of study volunteers either divided according to cognitive impairment (NCI, MCI or AD)(A) or Reagan score(B).(C, D) VAChT protein levels (Western blot) in the parietal cortices of study volunteers either divided according to cognitive impairment (NCI, MCI or AD)(C), or Reagan score(D). Individual values are shown and the bars represent the mean. Statistical comparisons were performed using a nonparametric Kruskal–Wallis test followed by Dunn’s multiple comparison tests.

