
FIGURE 2.
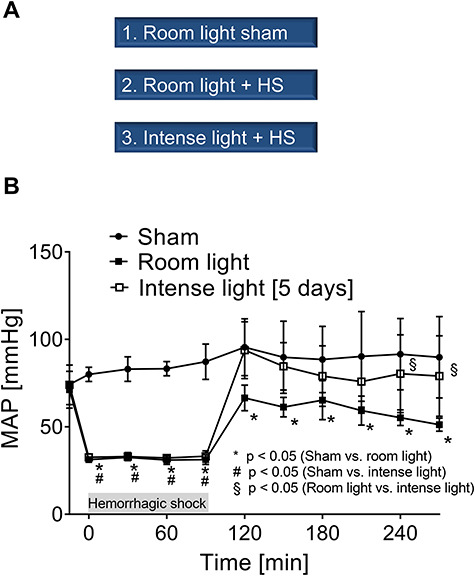
Experimental groups and MAP measurements. (A) Experimental groups. (B) MAP of mice undergoing hemorrhagic shock and resuscitation with and without intense light therapy versus sham mice (room light only). Data are mean ± SD with n = 4–5 mice for each group.