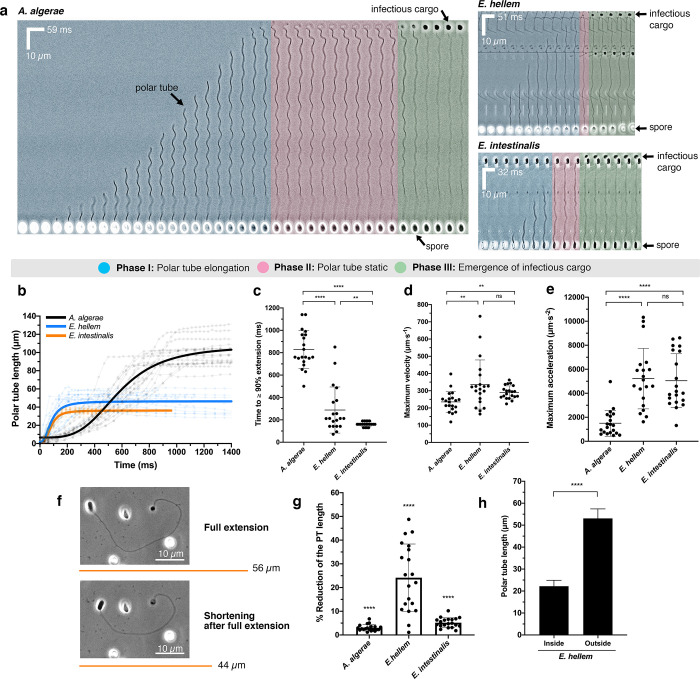
Fig 4. Live-cell imaging of PT germination.
(a) Kymographs showing representative spore germination events from three microsporidian species: A. algerae, E. hellem, and E. intestinalis. Scale bars for distance and time intervals are shown on each kymograph. Three phases of the germination process are color-coded. The A. algerae PT appears to have a wavy pattern as it emerges from the spore, possibly forming a spiral, while the E. hellem and E. intestinalis PTs are less wavy in nature. As infectious cargo emerges from the distal end of the PT, the amplitude of the waveform is reduced, as has been previously noted[24]. After the A. algerae PT is fully extended, the distal end of the fired PT is curved and forms a hook-like structure, as previously described[25]. See also S3–S5 Videos. (b) Quantification of the PT length as a function of time for A. algerae (black), E. hellem (blue), and E. intestinalis (orange) (n = 20 for each species). The raw data are shown as faint lines with time points indicated as circles. The overall trends of each species were fitted (see Methods) and are represented as thick lines in the corresponding color. (c) Time taken for PT to extend to ≥ 90% (TEXT90) of its maximum length (n = 20 for each species). ****p<0.0001, **p = 0.0096 (unpaired Student’s t-test). (d) Average maximum velocity of PT extension calculated as described in Methods (n = 20 for each species). **p = 0.006; ns, not significant (unpaired Student’s t-test). (e) Average maximum acceleration of PT extension (n = 20 for each species). ****p<0.0001; ns, not significant (unpaired Student’s t-test). (f) Shortening of the E. hellem PT after the full extension (maximum length) has been reached and cargo ejected. Representative phase-contrast micrographs are shown, and orange lines represent the length of the PT quantified from the micrographs. (g) Reduction of PT length measured 3 seconds after sporoplasm ejection, as a percentage of the maximum PT length (n = 20 for each species, see other representations of these data in S9A and S9B Fig). The PT shortens by 3%, 24%, and 5% for A. algerae, E. hellem, and E. intestinalis, respectively. ****p<0.0001 (One sample t-test). (h) Comparison of the PT length for E. hellem, in dormant spores, obtained from SBFSEM (labeled “inside”) and the maximum PT length after germination, obtained from live-cell optical microscopy experiments (labeled “outside”) (n = 20, see Methods for how these measurements were made). ****p<0.0001 (unpaired Student’s t-test). All error bars in this figure represent standard deviations.

