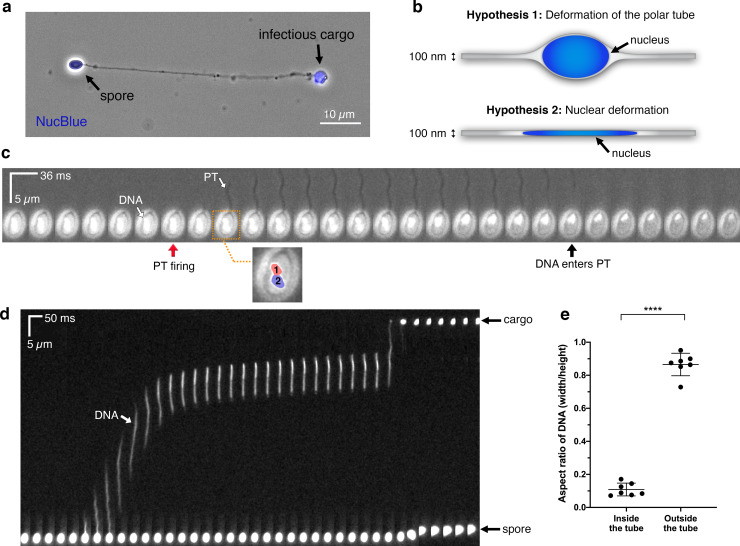
Fig 5. Live-cell imaging of nuclear transport through the PT.
(a) Image of a fixed germinated A. algerae spore stained with a nuclear dye, NucBlue, overlaid with a phase-contrast image of the same spore. (b) Schematic diagrams show two possible hypotheses of how large nuclei may travel through the narrow PT. Nucleus is depicted in blue; in “hypothesis 1” it is drawn as an oval, to scale with the PT (nucleus diameter = ~0.7 μm; PT diameter = ~100 nm). (c) Time-lapse images of the two A. algerae nuclei inside the spore during PT germination, with a time interval of 36 ms. Nuclei are pre-stained with NucBlue, and white light was applied in order to observe the PT firing event simultaneously. Red arrow indicates the frame in which PT firing is initiated; black arrow indicates the frame in which the nuclei begin to leave the spore body. Inset highlights the two nuclei, labeled with numbers and color overlays, from the frame boxed in orange. (d) Kymograph of nuclear translocation through the PT, with a time interval of 50 ms. (e) Quantification of the aspect ratio of the nuclei during transport (inside the tube) and after being expelled (outside the tube), which represents the extent of nuclear deformation during the process. Error bars represent standard deviation (n = 7), ****p<0.0001 (paired Student’s t-test).

