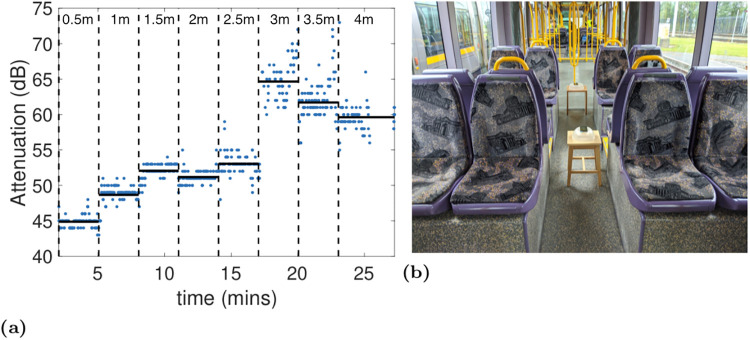
Fig 3.
(a) Measurements of attenuation between two handsets as the distance between them is varied along the centre aisle in the tram carriage, (b) shows the setup used. The vertical dashed lines indicate when the distance between the handsets was changed, starting at 0.5m and then increasing by 0.5m at each step. The solid horizontal lines indicate the mean attenuation level at each distance. Measurements taken using the standard Android Bluetooth LE scanner API.

