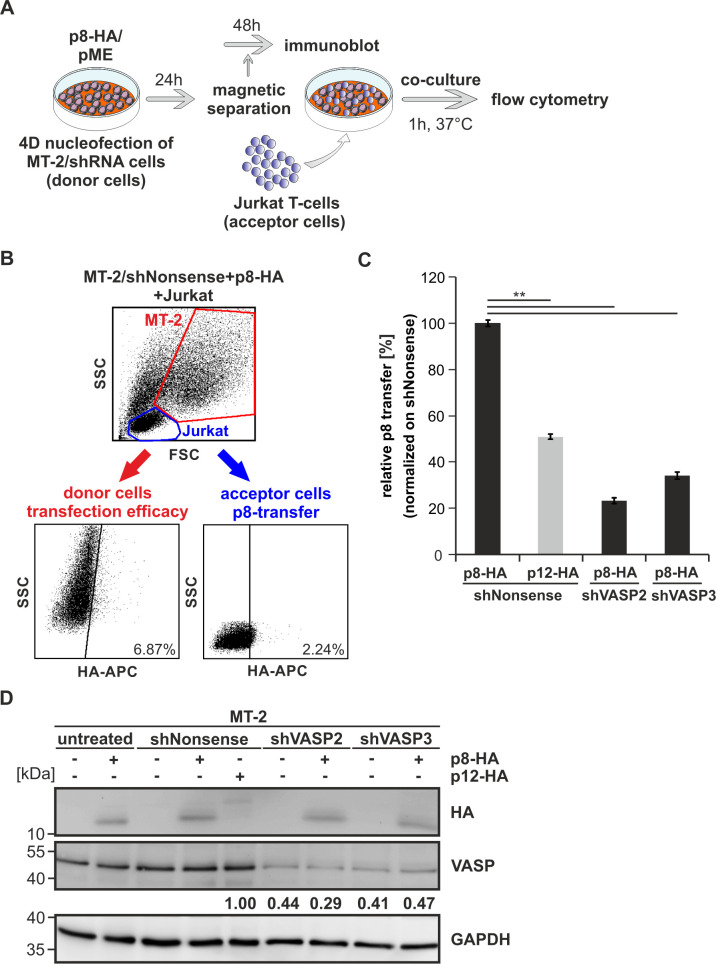
Fig 9. Repression of VASP impairs p8-transfer between chronically-infected MT-2 cells and uninfected T-cells.
(A) Experimental setup. (B-D) Stably transduced MT-2 cells (shNonsense, shVASP2, shVASP3) were nucleofected with p8-HA expression plasmids or a control plasmid together with pMACS-LNGFR. At 24 h post transfection, transfected MT-2 cells were enriched by magnetic separation using anti-LNGFR microbeads. Separated MT-2 cells were either (B-C) co-cultured with target Jurkat T-cells (ratio 1:1) for 1 h at 37°C and subjected to flow cytometry or (D) MT-2 cells were cultured for another 48 h and lysed for western blot analysis. (B) Flow cytometry of co-cultures after use of primary mouse anti-HA-APC conjugated specific antibodies. Representative dot plots are shown. Upper part: Jurkat acceptor cells (blue) and MT-2 donor cells (red) were gated by forward scatter (FSC) and side scatter (SSC) analysis. Lower part: HA-APC-specific fluorescence is plotted against the SSC and numbers represent the efficiency of transfection within the MT-2 donor cells (red, left side) or the transfer of p8 within the Jurkat acceptor T-cells (blue, right side). (C) The relative transfer of p8 from MT-2 cell lines (shNonsense, shVASP2, shVASP3) transfected with p8-HA or p12-HA to co-cultured Jurkat T-cells was calculated and values were normalized on MT-2/shNonsense. The means of four independent experiments ± SE were compared using Student’s t-test (**, p<0.01). (D) Western blot analysis depicting p8-HA or p12-HA and VASP in stably transduced MT-2 cells (shNonsense, shVASP2, shVASP3). Numbers indicate densitometric analysis of VASP normalized on GAPDH and shNonsense.

