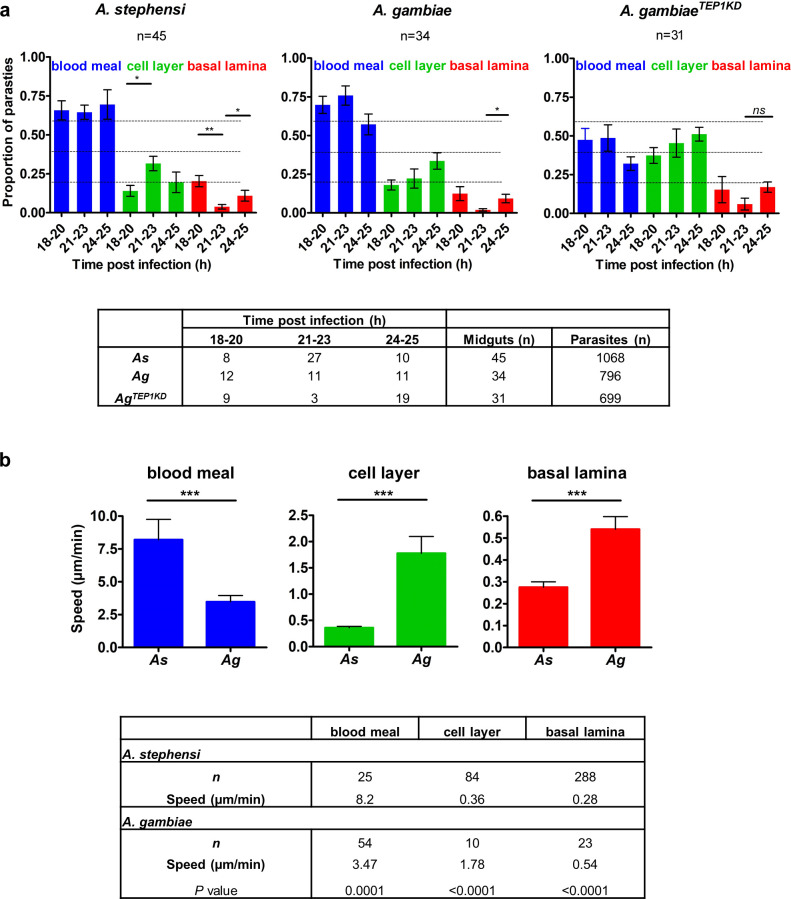
Fig 3. Kinetics of P. berghei invasion of A. stephensi and A. gambiae midguts.
a. Positions of parasites in A. stephensi (As), A. gambiae (Ag) and in A. gambiae mosquitoes silenced for TEP1 (A. gambiaeTEP1KD) between 18 and 25 h post infection (hpi). Plots show the proportion of parasites at each position (blood meal, cell layer, and basal lamina) for three time intervals (18–20, 21–23 and 24–25 hpi). Each bar represents the average proportion of parasites in midguts that contained at least 10 parasites. Parasite positions were calculated by the distance from the cell layer: blood meal for ookinetes detected more than 5 μm above the cell layer; basal lamina for parasites observed more than 5 μm below the cell layer. Statistical analyses were performed by a Mann-Whitney t-test. The table below shows the number of midguts analyzed at each time interval for each mosquito type. b. Speed of parasites as function of the parasite position in As and Ag. Speed (μm/min) was determined by tracking the parasites position over time from the time-lapse series. Four time-lapse experiments were used: guid 1615 and guid 1628 for As and guid 1622 and guid 2109 for Ag. The table below details the number of frames (n) used for speed calculations. Statistical significance of differences in the average speed at each given position between As and Ag were examined by the Mann-Whitney t-test and P ≤ 0.0001 are designated by three asterisks.

