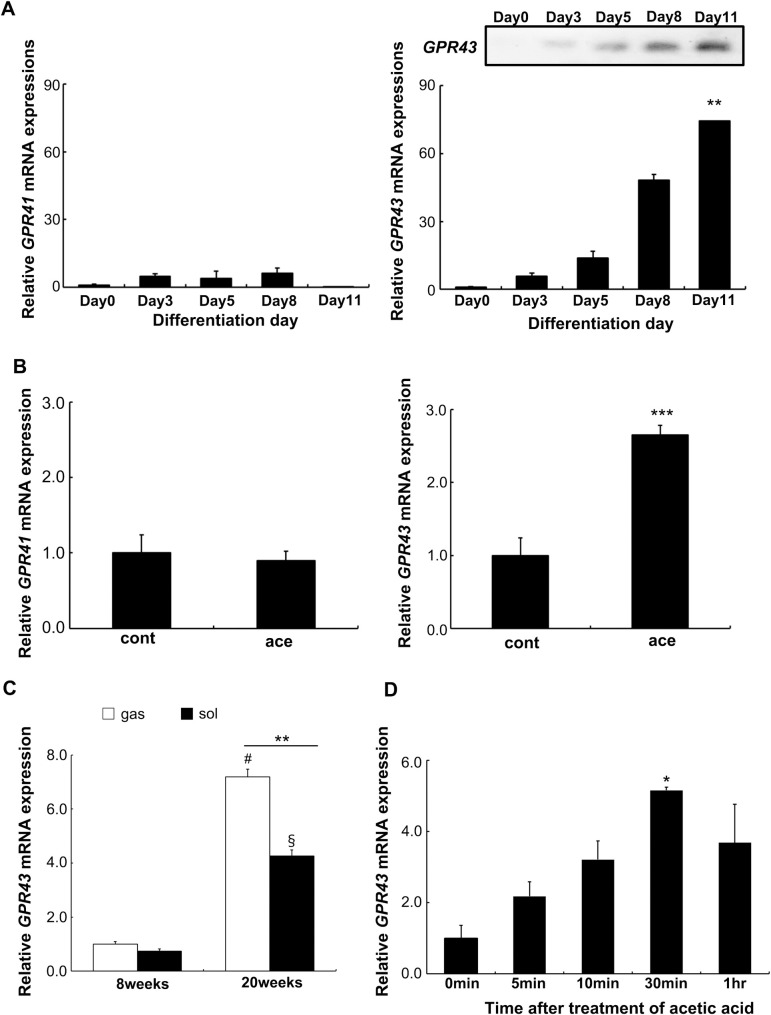
Fig 1. Effects of acetic acid on the expression of GPR43.
(A) Total RNA was extracted from the differentiating L6 cells to analyze the expression of GPR41 and GPR43 by real-time PCR. PCR product of GPR43 was confirmed by the electrophoresis with 2% agarose gels (insert image) Each expression level during the differentiation on each of the days was analyzed and compared among expressions of each gene. Multiple comparisons were analyzed with one-way ANOVA followed by Tukey-Kramer post hoc test. Each value is shown as the mean ± SE (n = 3–6). Statistical difference is shown as **p< 0.01, compared with day 0. (B) Expressions of GPR41 and GPR43 were measured in the differentiated L6 myotube cells that treated with 0.5 mM acetic acid for 30 min (ace) or untreated (cont). The statistical difference of each expression between ace and cont was analyzed using the unpaired Student’s t-test. Each value is shown as the mean ± SE (n = 3–6). Statistical difference is shown as ***p< 0.001, compared with cont. (C) Total RNA was isolated from gastrocnemius (gas) and soleus (sol) muscles of SD rats at 8 and 20 weeks of age, and the expression of GPR43 was determined. Multiple comparisons were analyzed with two-way ANOVA followed by Tukey-Kramer post hoc test. Each value is shown as the mean ± SE (n = 3–6). Statistical differences are shown as #p<0.05, compared with the expression in gas of 8 weeks; §P<0.05, compared with the expression in sol of 8 weeks; **p<0.01, compared the expressions between gas and sol. (D) Differentiated L6 cells were treated with 0.5 mM acetic acid for the indicated time periods and the GPR43 expression was analyzed. Multiple comparisons were analyzed with one-way ANOVA followed by Tukey-Kramer post hoc test. Each value is shown as the mean ± SE (n = 3–6). Statistical difference is shown as *p< 0.05, compared with 0 min.

