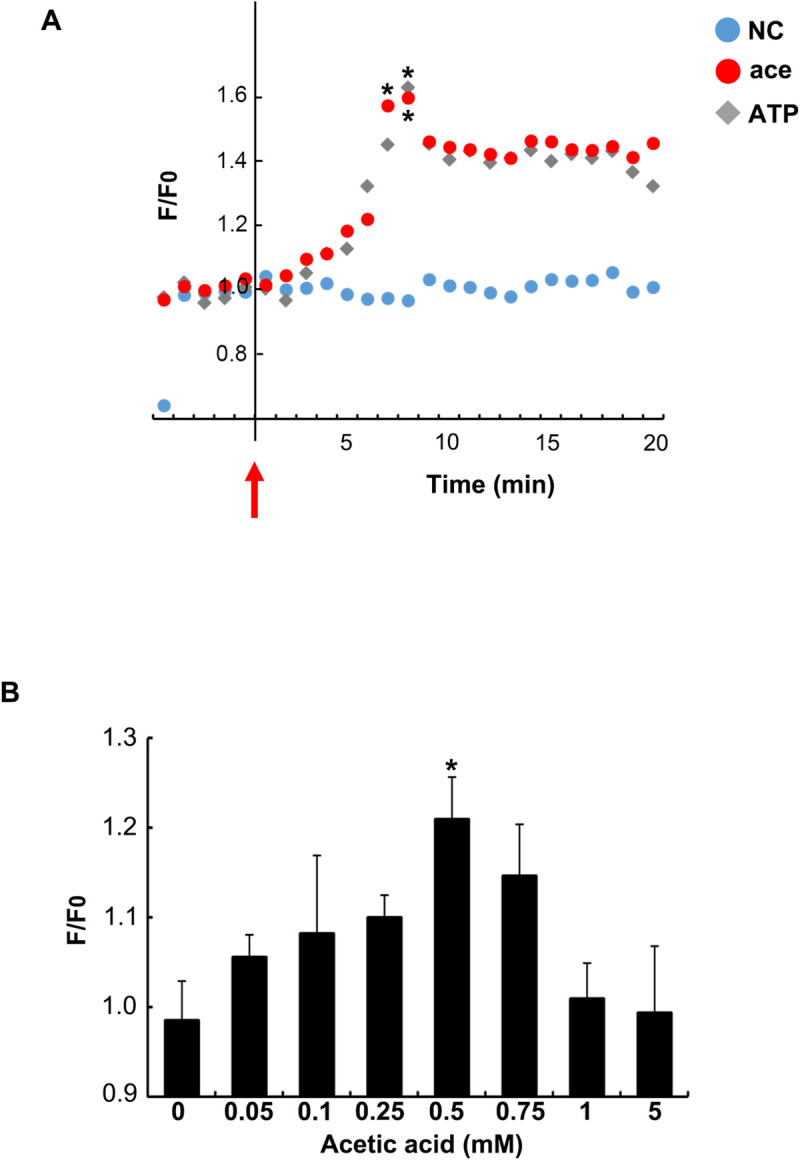
Fig 2. Effect of acetic acid on intracellular calcium influx.

(A) Acetic acid or ATP was each added to the culture medium of differentiated L6 cells at the time points indicated with an arrow. The [Ca2+]i influx in L6 cells was measured after stimulation with 0.5 mM acetic acid or 25 μM ATP. Data shown are average values from three to seven independent experiments. NC: Non-stimulated condition. Peaks of average values for each treatment were analyzed with one-way ANOVA followed by Tukey-Kramer post hoc test. Statistical differences are shown as *p< 0.05 compared with NC. (B) Intracellular [Ca2+]i influx was measured in 8 min after the treatment of acetic acid at each of the concentrations indicated in the figure. Each bar represents the mean ± SE (n = 3–7). Multiple comparisons were analyzed with one-way ANOVA followed by the Tukey-Kramer post hoc test. Statistical differences are shown as *p< 0.05, compared with untreated (0 mM).
