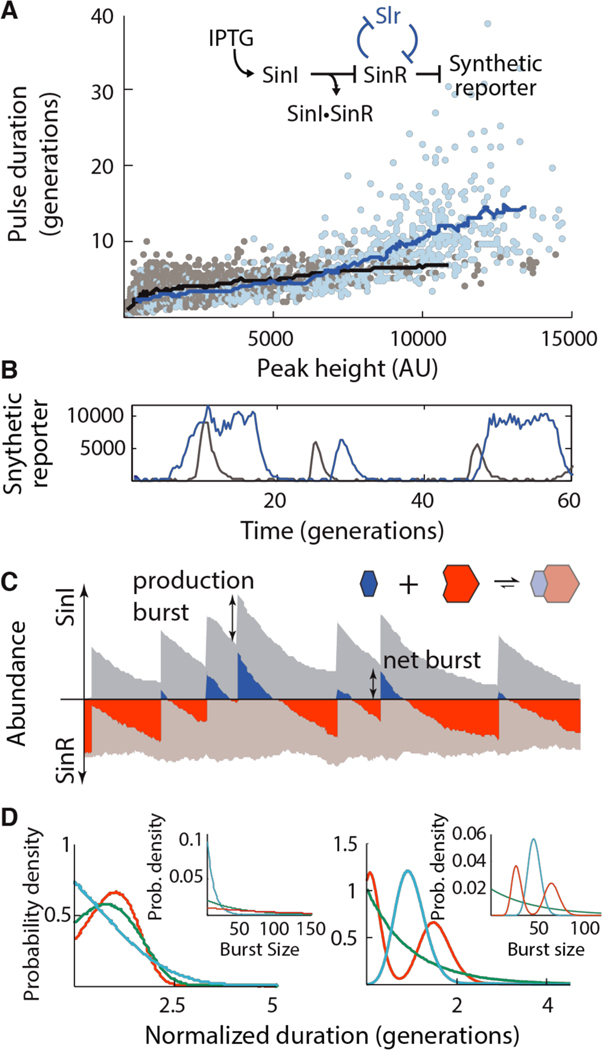
Fig. 3. Tuning commitment to the ON state.
(A) Scatter plot relating the peak duration and height in the reconstitution strain (NDL-423, grey points; 90 uM, 100 μM and 110 μM IPTG conditions) and the SlrR+ feedback strain (NDL-419; identical to NDL-423 but containing a SinRcontrolled slrR allele, blue points; 60 uM, 80 μM and 100 μM IPTG conditions). Bulk trends are indicated with sliding mean curves. Inset: genetic logic of the reconstituted circuit. (B) Example traces of the reconstitution strain (NDL-423, grey) and SlrR+ feedback strain (NDL-419, blue) grown in 90 μM and 60 μM IPTG, respectively. (C) Schematic of SinI bursting in stochastic competition. Abundances of free SinI and SinR (dark blue and dark red, respectively) and bound SinI and SinR (light blue and light red, respectively) are plotted for a single simulated trace. Total SinI and SinR levels are indicated by the stacked height of the free and bound curves. Rare, large bursts of SinI (‘production burst’) titrate all free SinR, leading to a pool of free SinI (the ‘net burst’) that then decays away due to a combination of dilution and titration by newly produced SinR. (D) Timing behaviors of stochastic competition. Left panel: In the strong dilution regime, bursty production produces timed periods of SinI dominance. SinI dominance durations were simulated (main panel) for processes in which SinI is produced in geometrically-distributed bursts (inset) of average size 10 (blue), 50 (green) and 100 (red) molecules. Right panel: In the weak dilution regime, SinI bursts are faithfully copied into commitment times. Dominance durations (main panel) were simulated for processes in which SinI mRNA has exponential (green), gamma (blue) and bimodally-distributed lifetimes (inset).

