. 2020 Aug 4;297(1):87–96. doi: 10.1148/radiol.2020200443

Figure 6:

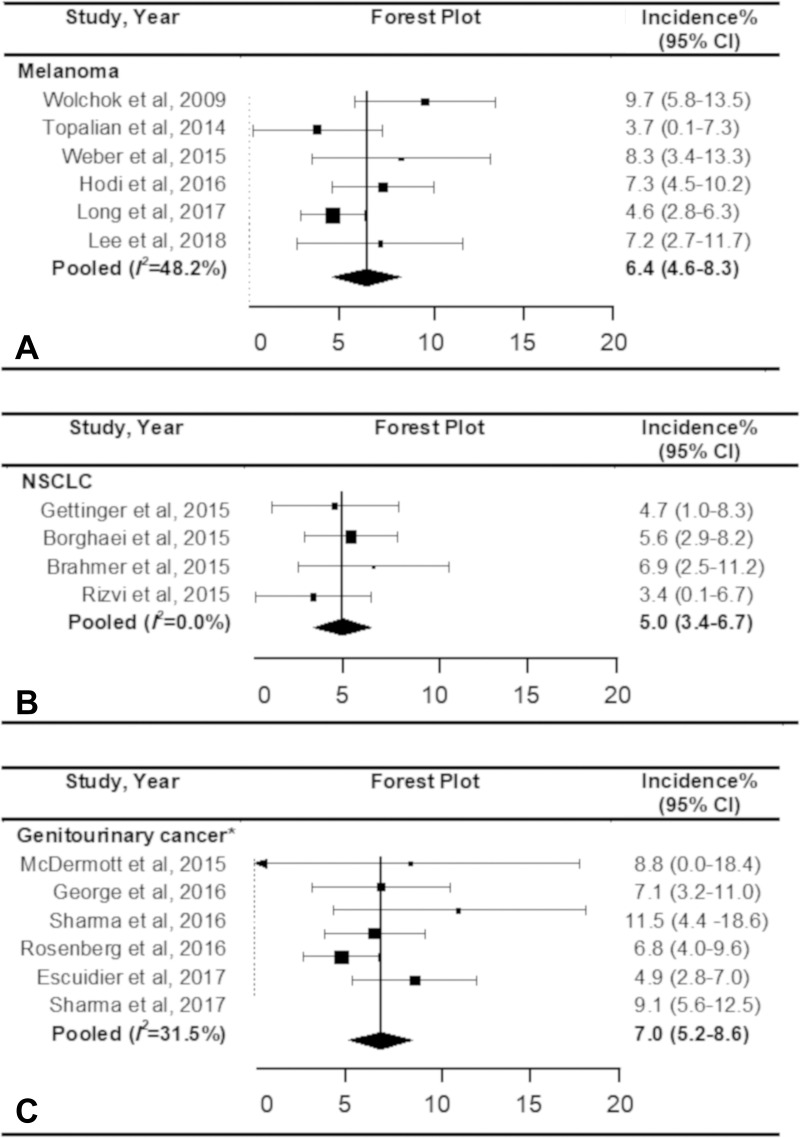
Forest plots show the pooled incidence of pseudoprogression according to the type of cancer. The pooled incidence of pseudoprogression was, A, 6.4% for melanoma, B, 5.0% for non–small cell lung cancer (NSCLC), and, C, 7.0% for genitourinary cancer. * Included renal cell carcinoma and urothelial cell carcinoma. CI = confidence interval.

Forest plots show the pooled incidence of pseudoprogression according to the type of cancer. The pooled incidence of pseudoprogression was, A, 6.4% for melanoma, B, 5.0% for non–small cell lung cancer (NSCLC), and, C, 7.0% for genitourinary cancer. * Included renal cell carcinoma and urothelial cell carcinoma. CI = confidence interval.