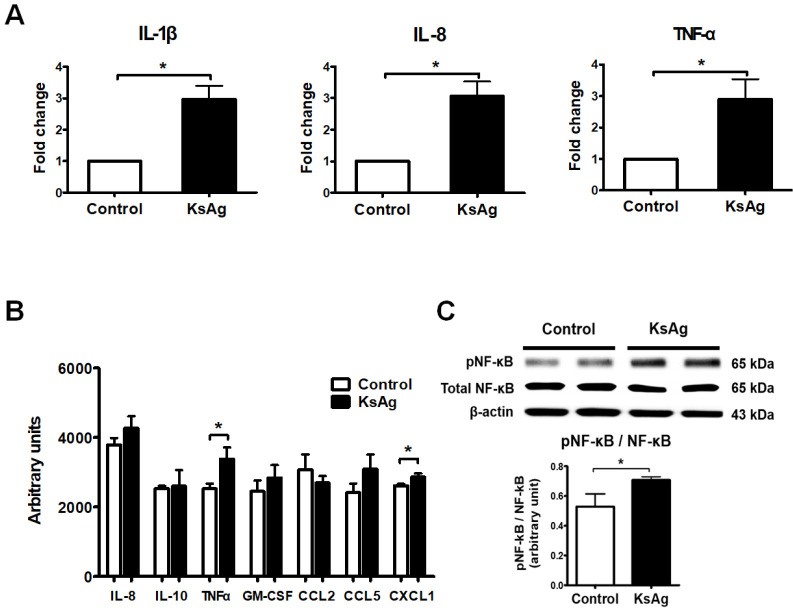
Fig. 2.
Induction of inflammatory cytokines and NF-κB activation in KsAg-stimulated HT29 cells. (A) mRNA expression of inflammatory cytokines in HT29 cells. Data are presented as the mean ± SD of fold changes for each cytokine versus the control. (B) Cytokine array and (C) Western blotting for NF-κB phosphorylation and the expression ratio of phospho-NF-κB/total phospho-NF-κB (n = 4). *P < 0.05.

