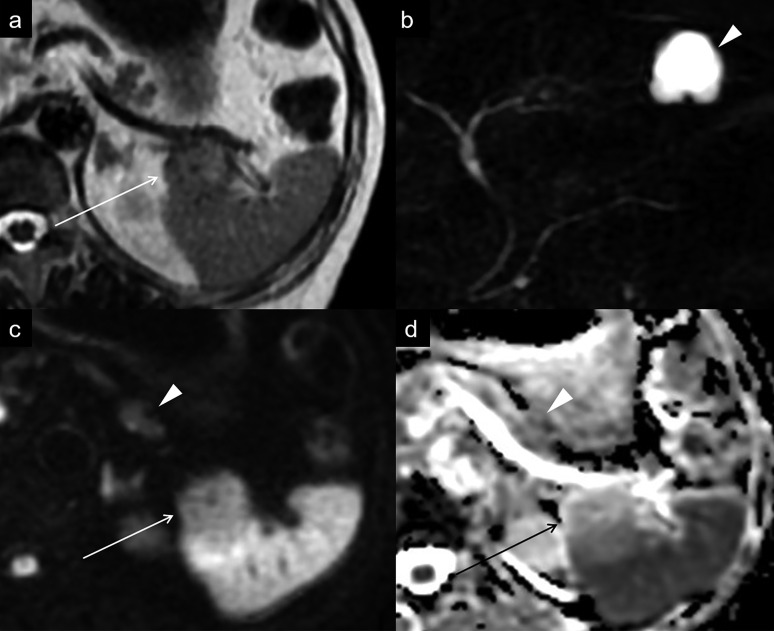
Figure 2.
(a) On a T2 weighted image, the mass shows slightly high signal intensity without cystic components (arrow). (b) On MR cholangiopancreatography, no signal of the lesion is detected. The arrowhead shows a hepatic cyst. (c) On a diffusion-weighted image at b-value of 800 s/mm2, the mass (arrow) shows isosignal intensity compared with the pancreatic parenchyma (arrowhead). (d) ADC map shows that the mass (arrow) has higher ADC values than the pancreatic parenchyma (arrowhead). ADC, apparent diffusion coefficient.

