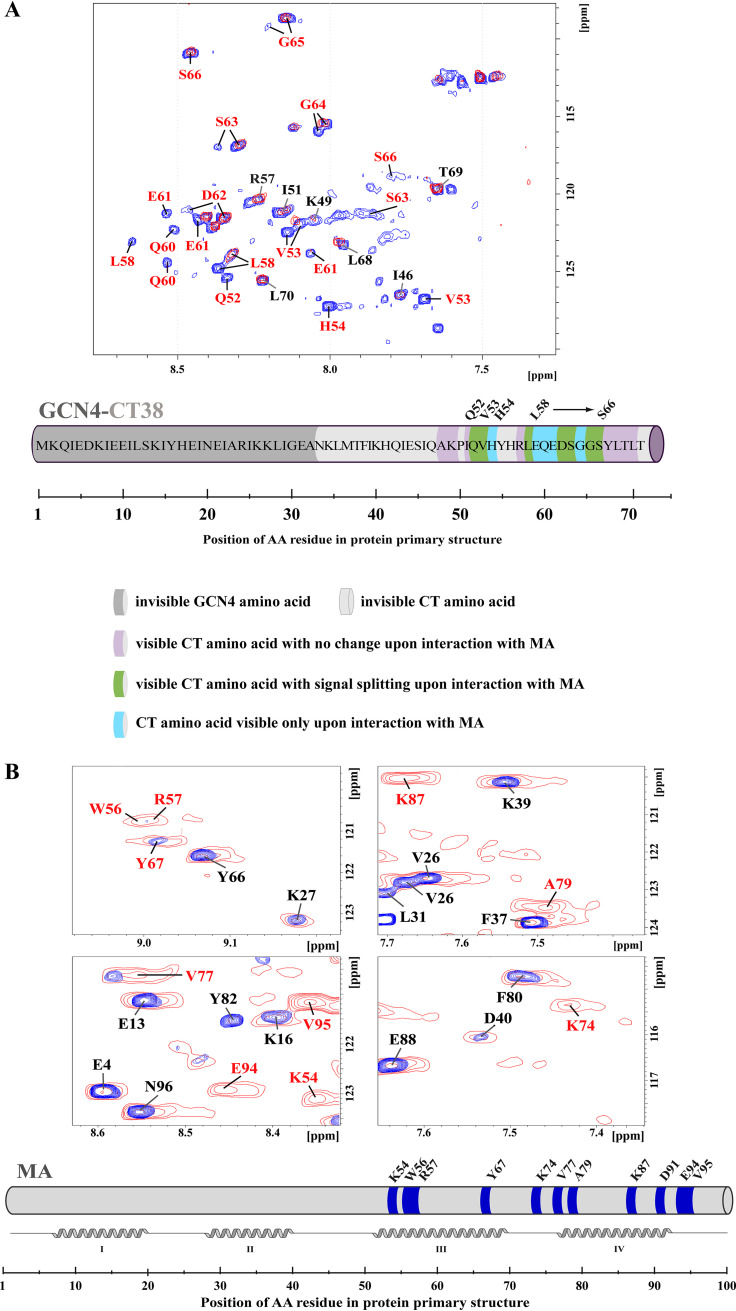
FIG 3.
NMR analysis of the interaction interface between GCN4-CT38 and MA. (A) Overlaid HN-HSQC spectra of free 15N-labeled GCN4-CT38 (red) and 15N-labeled GCN4-CT38 with 10-fold molar excess of the nonmyristoylated MA 3 days after mixing (blue), (B) Overlaid HN-HSQC spectra of the free 15N-labeled nonmyristoylated MA (red) and the 15N-labeled nonmyristoylated MA with 10-fold molar excess of GCN4-CT38 3 days after mixing (blue). The NMR signals that changed upon the interaction with MA (labeled in red) indicate the residues of CT38 or MA, which are involved in the interaction. The NMR signals that remained unchanged upon the interaction are labeled in black. In the schematic view of the MA sequence, the noninteracting residues of the MA are colored in gray, and the residues interacting with the CT38 are colored in blue.

