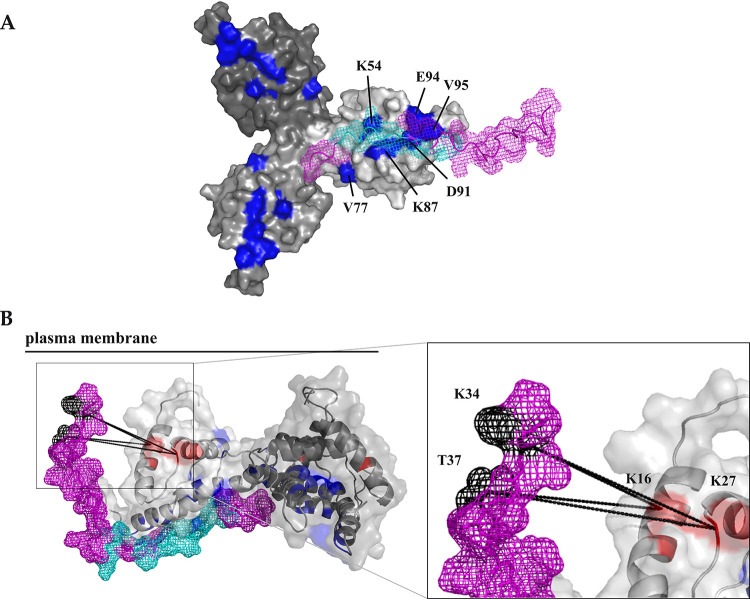
FIG 7.
Model of the CT complex with a trimeric MA. (A) MA-CT38 complex calculated in HADDOCK based on NMR results. (B) Model of the MA-CT complex created based on HADDOCK calculation (the C-terminal part of the CT38) and the results of XL-MS (the N-terminal part of the CT), where the N-terminal part of the CT sequence was twisted around the MA to meet the restrains determined by identified cross-links. Trimeric MA (30) is shown in the surface representation (A) or in the cartoon representation with a transparent surface (B), and single MA monomers are colored in different shades of gray. The MA residues identified by NMR spectroscopy as interacting with the CT38 are colored blue, and the MA residues forming cross-links with the CT38 residues are colored red. CT38 is shown in ribbon with mesh surface representation colored violet. The CT38 residues identified by NMR as interacting with the MA are colored, cyan and the CT38 residues forming cross-links with MA residues are colored black. The cross-links are displayed as dashed lines. The plasma membrane is depicted as a full line to express the orientation of the MA-CT38 complex on the membrane.

