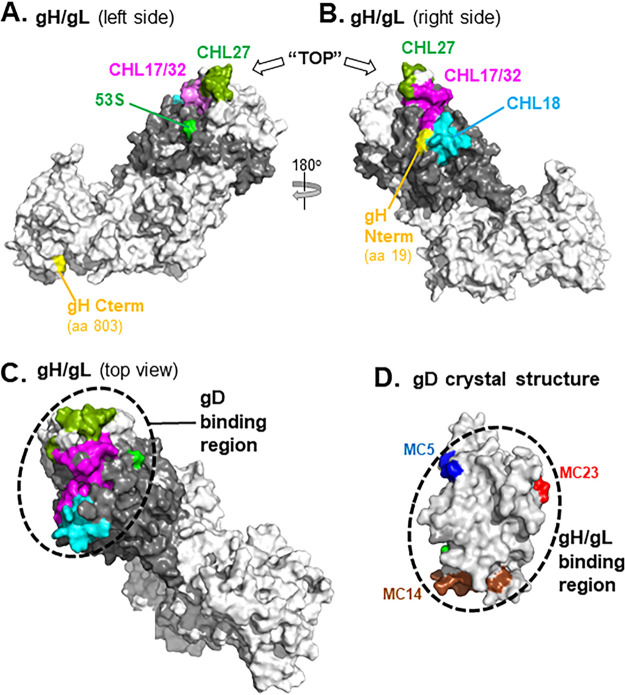
FIG 13.
Localization of the gD binding site on a gH/gL 3D modeled structure. The gH/gL model is rotated 180° between (A) and (B). gH is shown in white and gL in gray. Residues within each of the following MAb epitopes are highlighted by color: CHL17/32 (gH residues 19 to 38; magenta); CHL27 (gH residues 39, 41, 43, and 44; olive); 53S (gL residue 77; green); and CHL18 (gL residues 209 to 219; cyan). To orient the molecule, the gH N and C termini are highlighted in yellow. In (C), gH/gL is uniformly colored white and positioned from the “top” so the epitopes that define the gD binding region (black dotted circle) can be viewed together. (D) Surface representation of the gD crystal structure (PDB: 2C36). Antibody-resistant mutations that were used to position the epitopes of anti-gD MAbs that block gH/gL binding are colored on the structure (MC5, blue; MC23, red; MC14, brown) (21). The gH/gL binding region is marked with a dashed circle.

