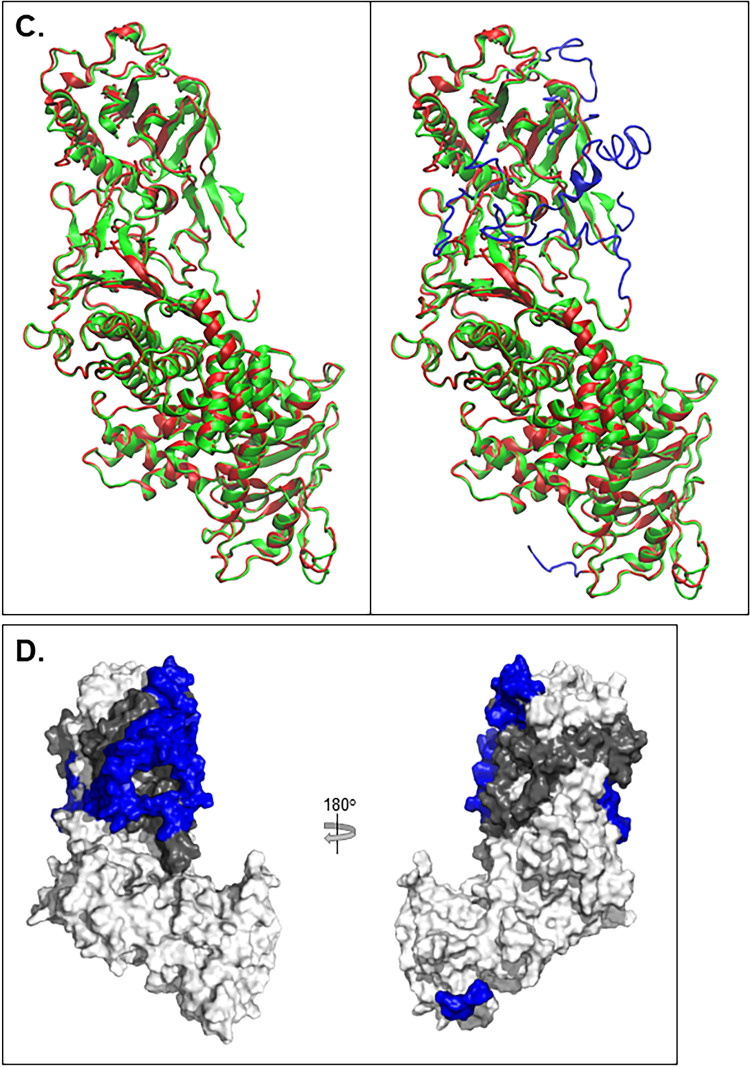
FIG 3.
gH2/gL2 3D model comparison with gH2/gL2 crystal structure. (A) The gH2 ectodomain protein sequence view. Amino acid numbers are displayed along the top. The signal peptide (residues 1 to 18) was removed for model determination. The sequence on top represents the fully constructed gH2 model while the sequence underneath represents the crystal structure with missing residues represented as “∼” (19 to 48, 116 to 136, and 798 to 803). Beta sheets are depicted with a blue arrow, and alpha-helices with a red cylinder. A similar view is shown for gL2 (B), where residues 1 to 16 encompass the signal peptide and the missing crystal structure residues span 17 to 23 and 166 to 224. (C) Superimposition of the gH2/gL2 crystal structure (PDB: 3M1C) (green) and the fully constructed ectodomain model (red). The image on the left shows only the portions of the model that overlap the crystal structure. The image on the right displays the fully constructed model with the missing residues shown in blue. (D) Surface view of the gH2/gL2 complex, with gH shown in white, gL in gray, and missing gH/gL residues shown in blue.


