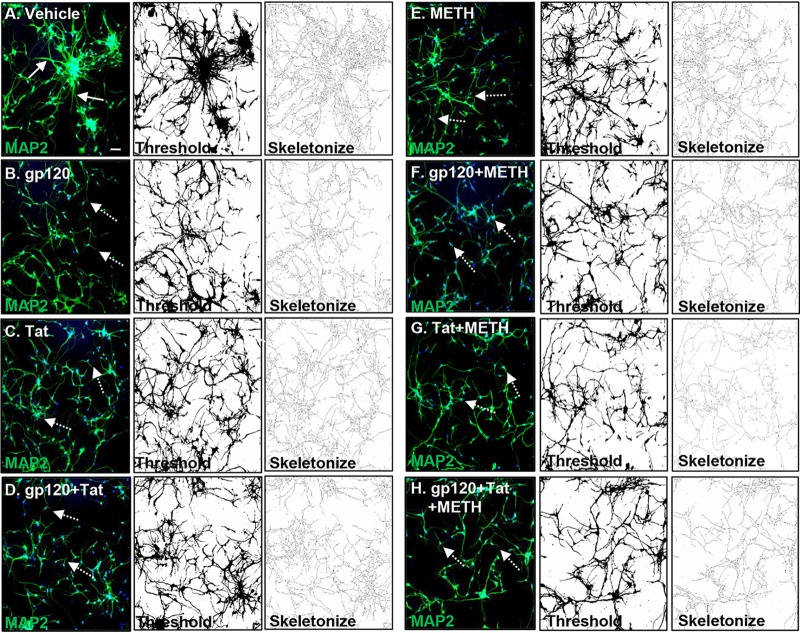
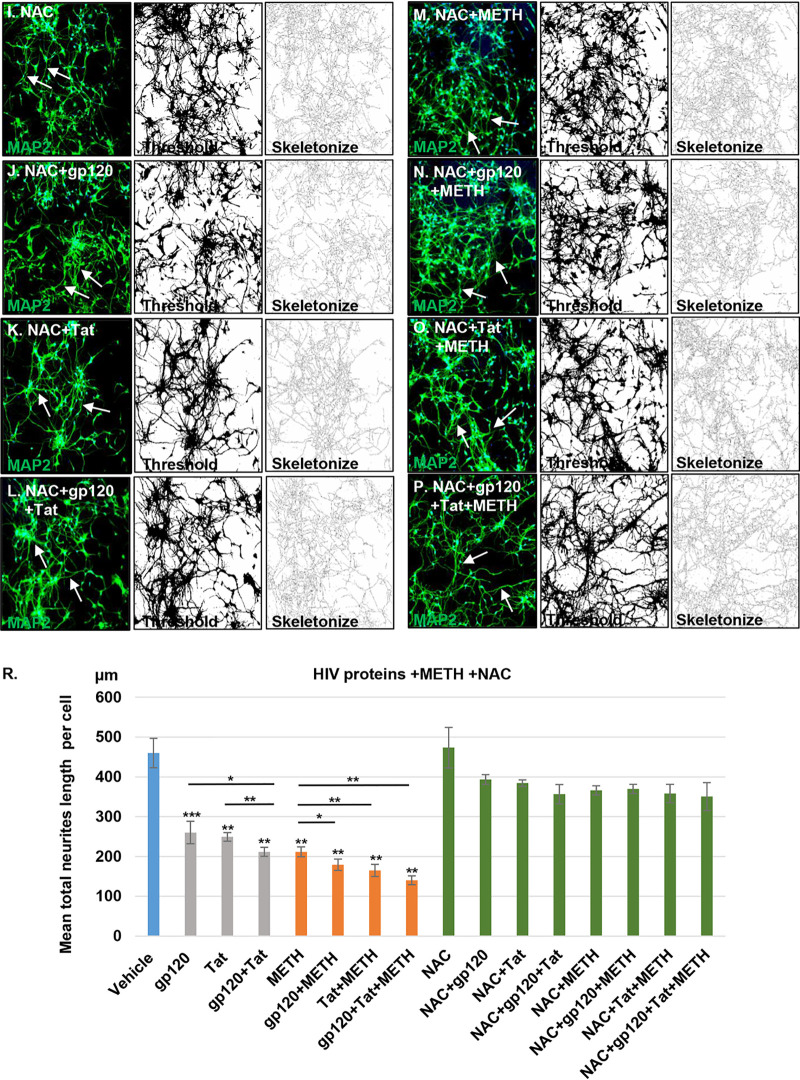
FIG 8.
Quantitative analysis of MAP2 dendritic network. (A) Confocal analysis shows that vehicle-treated cells display a healthy neuronal network (as indicated by the white arrows). (B to H) Confocal analysis of MAP2 dendritic network showing a reduction of the neuronal dendrites in HIV, methamphetamine, or combination treatments (as indicated by the white dashed arrows). (I to P) NAC pretreatment abrogated dendritic reduction in HIV- and methamphetamine-treated neurons (indicated by the white arrows). For panels A to P and panel R, Fiji software analysis was used to process and analyze confocal images by applying thresholding and skeletonization functions. The Simple Neurite Tracer function was used to quantify the length of the neuronal dendrites. Student's t test was performed to test the statistical significance. Data are presented as mean values ± standard deviations (n = 3 independent donors). *, P < 0.05; **, P < 0.01; ***, P < 0.001. Scale bar, 50 μm.


