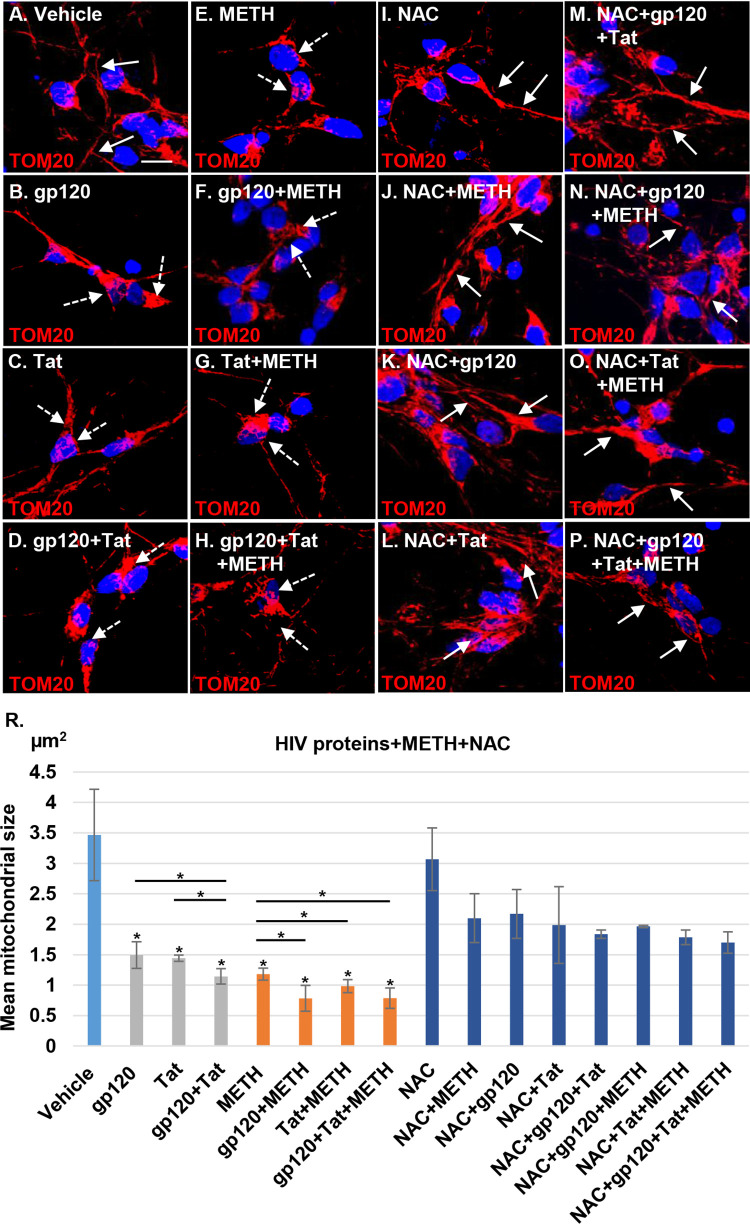
FIG 9.
Mitochondrial shape and network disruption are reversed by NAC posttreatment in HIV-treated cells. (A) Confocal laser microscopy analysis showing healthy tubular mitochondrial structures (indicated by the white arrows) in vehicle-treated cells. (B to H) Cells were treated for 24 h with 100 ng/ml gp120, Tat, or gp120/Tat and 300 μM methamphetamine alone or in combination with HIV proteins. Confocal microscopy shows mitochondrial aggregation and fragmentation (indicated by the dashed white arrows). Mitochondria were stained with TOM20 (red); 4′,6′-diamidino-2-phenylindole (blue) was used to stain nuclei. (I to P) HIV- and methamphetamine-exposed neurons after treatment for 48 h with NAC. Confocal microscopy shows the recovery of the mitochondrial size following NAC posttreatment. (R) Quantitative analysis of mitochondrial size using ImageJ-Fiji software. Student's t test was performed to test the statistical significance. Data are presented as mean values ± standard deviations (n = 3 independent donors). *, P < 0.05. Scale bar, 10 μm.

