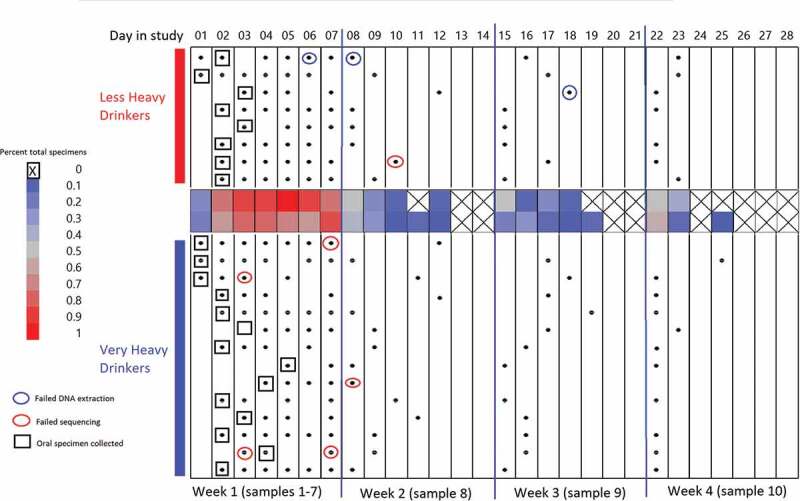
Figure 3.

Gut and oral specimen sampling chart over 28 d of inpatient treatment. X-axis along the top of the chart indicates the day in the study (Day 1–Day 28) segmented by 4 -week intervals. Black dots: gut specimens. Open boxes: oral specimens. Blue circles: specimens failing DNA extraction. Red circles: specimens failing sequencing. Center heat map: average total specimens for that day.
