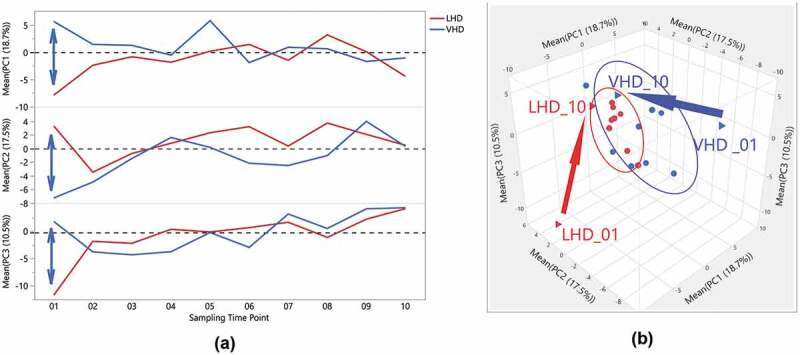
Figure 7.

Distinctiveness and overlap of LHD and VHD groups, across time, following abstinence, for the first three Principal Components of the gut microbiome. (a) One-way overlay plot of the average over participants for the first three Principal Components (y-axis) versus the ten sampling time points (x-axis). The average PC over all patients in each group for each time point was calculated to determine centroids. The double-headed arrow indicates differences between centroids of first time points between each drinking group. (b) Three-Dimensional Scatter Plot of the averages of the first three Principal Components for LHD (red) and VHD (blue) groups. The first and last time point, i.e. VHD_01, LHD_01, VHD_010, LHD_010, are shown as triangles. A vector is drawn from the first time point to the last time point within each group showing the direction. As shown in this view, the first time points for each group appear to be outliers when compared to the rest illustrating extensive change in gut microbiome following abstinence.
