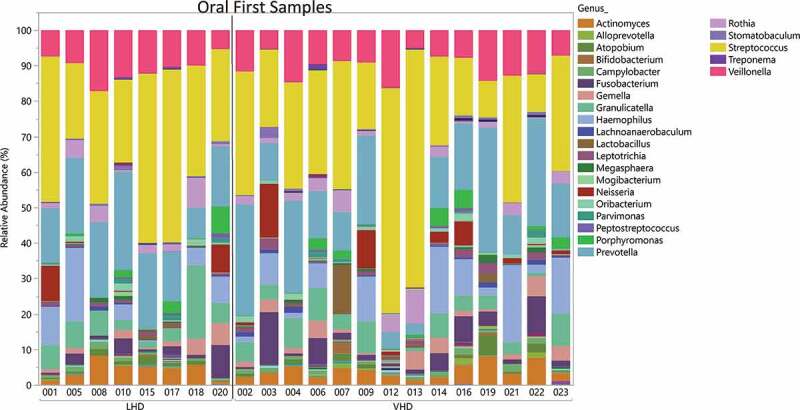
Figure 9.

Relative Abundance of Oral Genera in LHD and VHD. Each vertical bar represents the relative abundance of the oral sample matching the initial stool sample for that participant. Legend lists only those genera having at least 1% or more abundance.
