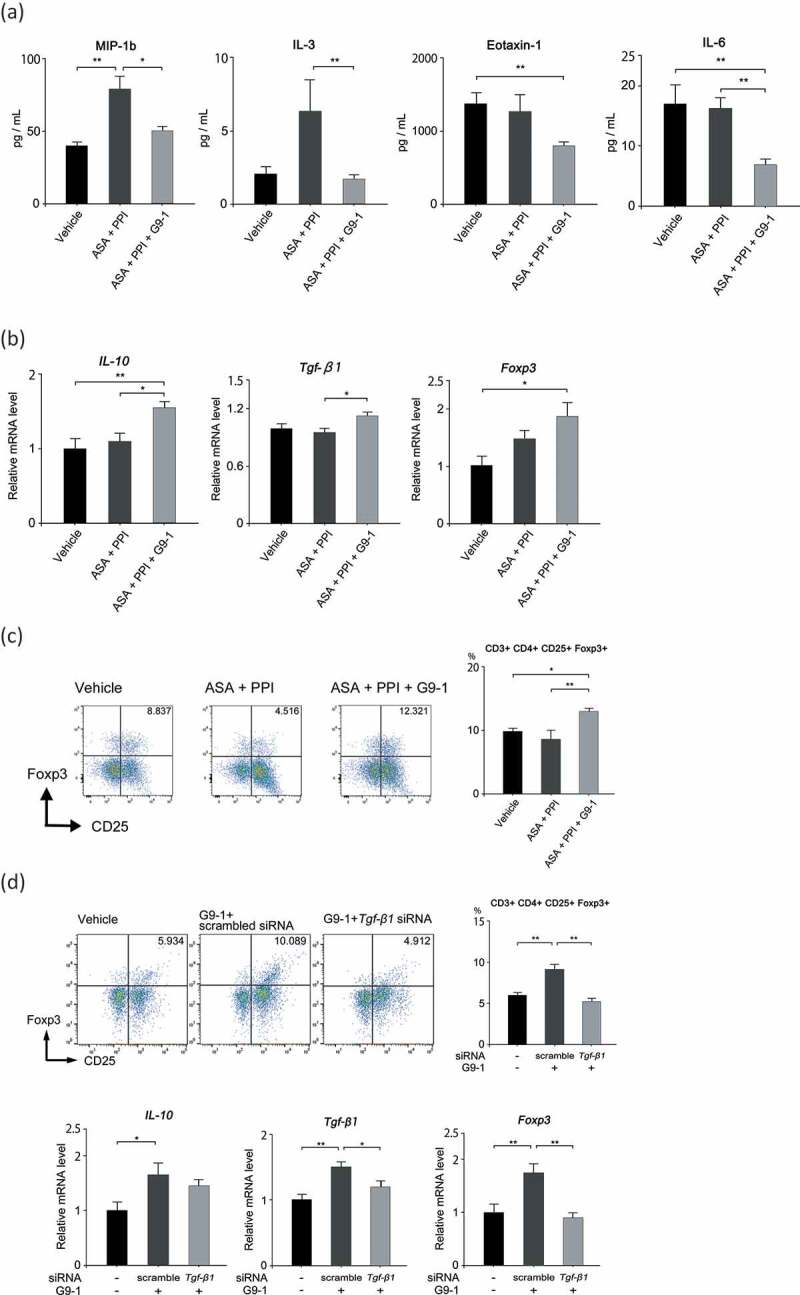
Figure 5.

Effect of G9-1 on Treg induction-associated inflammatory cytokines and chemokines. (a) Expression levels of inflammatory cytokines and chemokines in the sera of mice in the different treatment groups (n = 5–10 per group). (b) Levels of Il-10, Tgf-β, and Foxp3 gene expression in the jejunum of mice in the different treatment groups (n = 5–7 per group). (c) Flow cytometric analysis of isolated lamina propria cells. Flow was first gated on CD3+CD4+ cells and then on CD25+Foxp3+ cells (n = 4–5 per group). (d) Flow cytometric analysis of isolated lamina propria cells and levels of Il-10, Tgf-β, and Foxp3 gene expression in the jejunum of mice. The Tgf-β1 siRNA was transfected 48 h and 12 h before sacrifice. Scrambled siRNA was used as a control against the Tgf-β1 siRNA (n = 8–10 per group for the flow cytometric analysis, n = 5–7 per group for the PCR analysis). Data are means ± SEM. *p < .05, **p < .01, Tukey-Kramer test (a–d).
