
Figure 2.
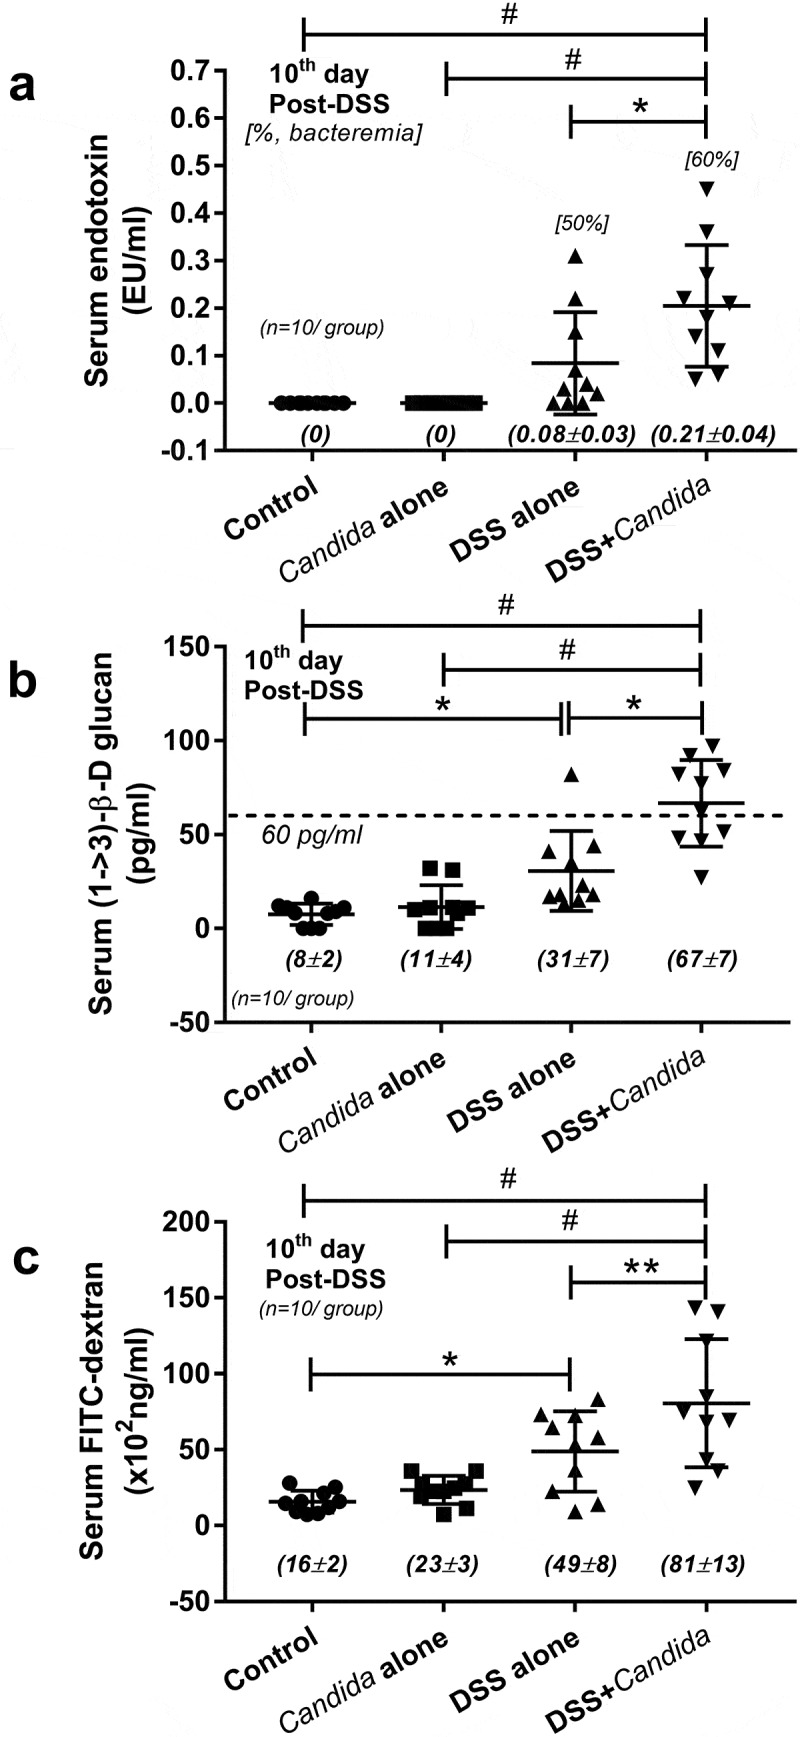
Serum endotoxin (b), serum (1 → 3)-β-D-glucan (BG) (c) and gut leakage (FITC-dextran assay) (d) in dextran sulfate solution (DSS) induced colitis mouse model, a representative model of IBD, is shown. Of note, the difference among groups was determined by ANOVA with Tukey’s analysis with n = 10/group for b–d. The [] in B demonstrated percentage of mice in each group that bacteria were detectable in blood (bacteremia). *, p < .05; **, p < .01; #, p < .001.