
Figure 6.
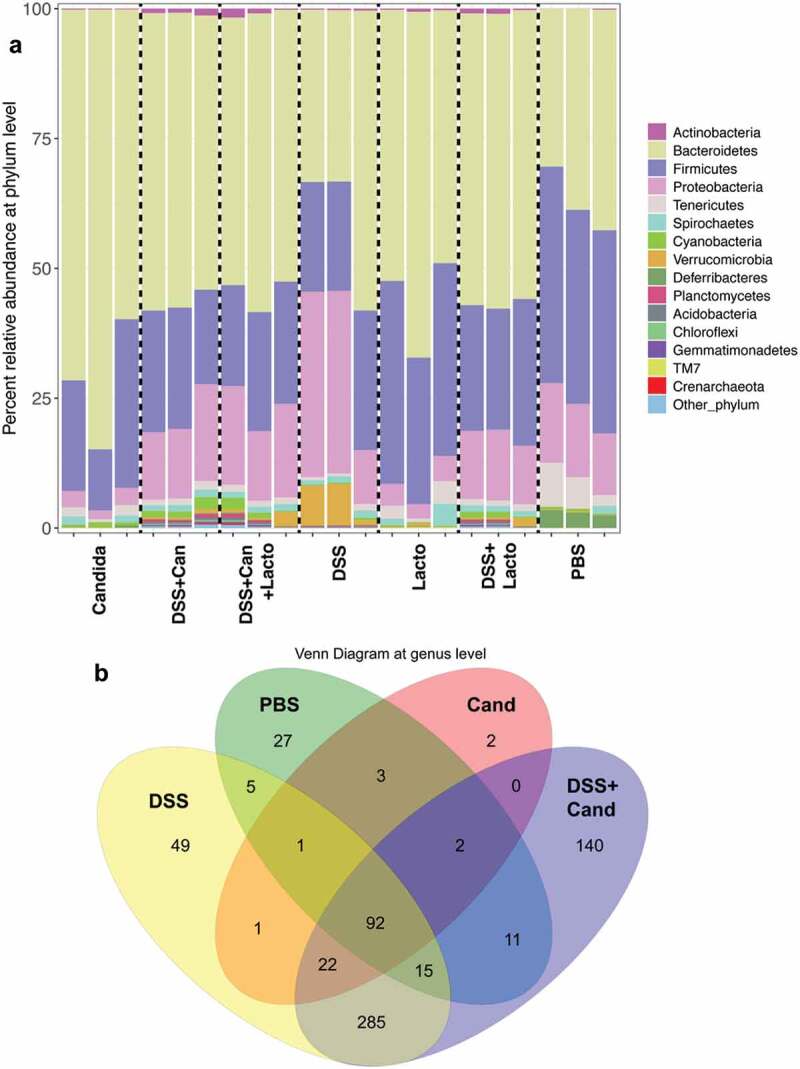
Gut microbiota analysis from feces of mouse administered with Candida albicans alone (Candida), dextran sulfate solution with C. albicans (DSS+Can), DSS+Can with Lactobacilli rhamnosus L34 administration (DSS+Can+Lacto), dextran sulfate solution alone (DSS), DSS with Lactobacilli (DSS+Lacto) and control gavage with phosphate buffer solution (PBS) (n = 3/group that retrieved from 9 mice; see methods) by relative abundance of bacterial diversity at phylum (a) and Venn diagram at genus level (b) and relative abundance at genus (c) are shown (unclassified-phyla were removed). Abbreviation “p”, “c” and “o” means unclassified family sequences in phylum, class and order, respectively, and genera that contain <0.01% relative abundance were removed. Downward and upward arrows demonstrate prominent Gammaproteobacteria in DSS+Candida and Enterobacteriaceae in DSS alone, respectively.