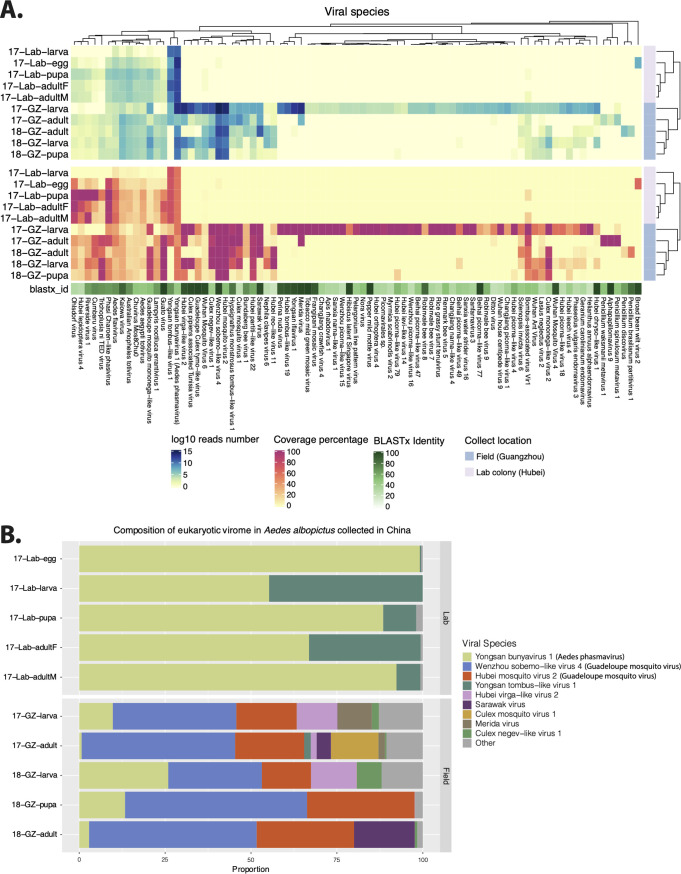
FIG 1.
Eukaryotic viral genomes in wild and lab-derived Aedes albopictus pools. (A) The heat maps show the total number of mapped reads on a log10 scale (upper panel) and length coverage (lower panel) of assembled contigs of each virus. The hierarchical clustering is based on the Bray-Curtis distance matrix calculated from the number of log10 reads. The viral species names shown in the heat map are from the taxonomic annotation by DIAMOND and KronaTools. For each of the contigs assigned to a particular species, the open reading frame (ORF) with the highest BLASTx identity to a reference sequence was taken, and the median identity of these different ORFs is shown in the shaded green bar. (B) Relative abundances of the viral species in each pool based on the number of reads.

