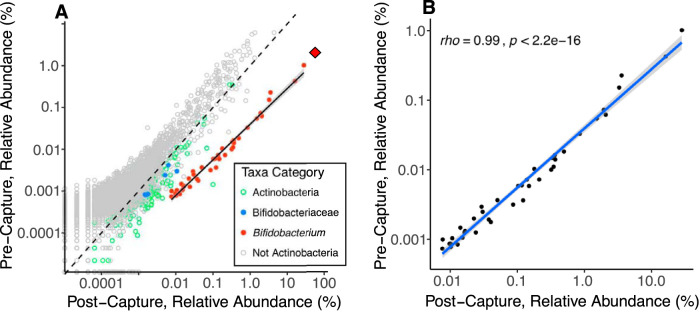
FIG 2.
Bifidobacterium is proportionally enriched using genome capture. (A) Relative abundance of all species-level annotations from the genome capture subset (n = 46), with each point representing the mean relative abundance of a distinct species-level classification before (precapture) and after (postcapture) the Bifidobacterium-DNA capture assay. Points are colored by taxonomic relatedness to Bifidobacterium. Pre- and postcapture libraries from a single sample were shotgun sequenced independently. The dashed 1:1 line represents equal relative abundances in pre- and postcapture libraries, and points below the 1:1 line are enriched in postcapture libraries relative to precapture libraries. The solid black line shows the least-squares regression between pre- and postcapture for the Bifidobacterium annotations. The shallower slope of the Bifidobacterium enrichment line than of the 1:1 line indicates greater enrichment of more common taxa. The red diamond shows the total relative abundance of Bifidobacterium (i.e., the sum of all Bifidobacterium annotations) in each of the pre- and postcapture libraries. (B) Same data as plot A but showing only Bifidobacterium annotations. The blue line shows least-squares regression with 95% confidence intervals; Spearman’s rho is shown along with the significance of the correlation.

