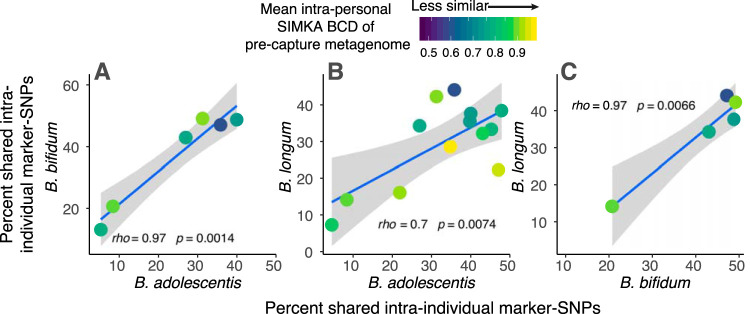
FIG 6.
Intraindividual marker-SNP sharing across different Bifidobacterium species. Each plot shows the percentage of marker-SNPs shared within an individual over time for two different Bifidobacterium species; each of three comparison possibilities is shown across plots A, B, and C. Each point represents a comparison between longitudinal samples from the same individual. Points are colored by the Simka Bray-Curtis Dissimilarity (BCD) value between the two samples, as measured from precapture metagenomes, and is therefore a measure of overall microbiome dissimilarity over time within an individual. Blue line shows least-squares regression with 95% confidence intervals, and Spearman’s rho along with the significance of the correlation is shown.

