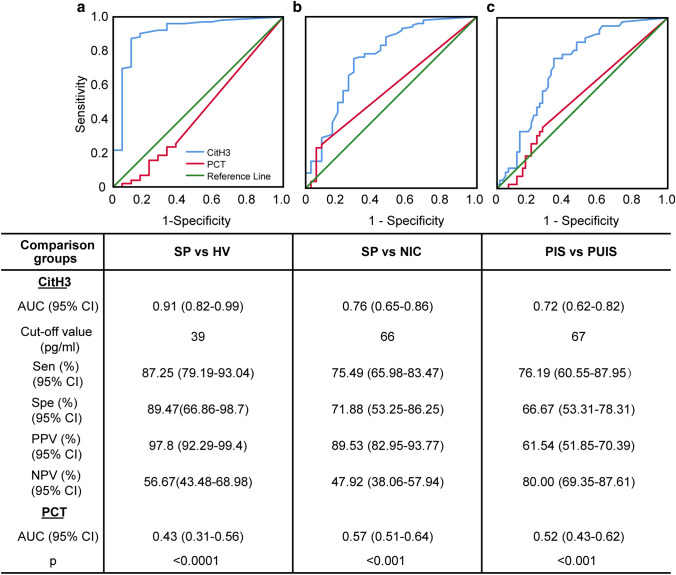
Fig. 2.
Citrullinated histone H3 performs better as a candidate diagnostic biomarker than procalcitonin for sepsis. Receiver operating characteristic curves analysis of citrullinated histone H3 and procalcitonin for sepsis diagnosis compared to (a) healthy controls and (b) non-infections disease controls. c Receiver operating characteristic curve analysis of citrullinated histone H3 and procalcitonin to distinguish septic patients with identified infection source from septic patients with un-identified infectious source. The receiver operating characteristic curve analysis of citrullinated histone H3 and procalcitonin are presented in the separate table under the figures. The values of p < 0.05 for CitH3 in all receiver operating characteristic curves and p > 0.05 for procalcitonin. The p value in the last row of the table shows the difference of area under the receiver operating characteristic curves between citrullinated histone H3 and procalcitonin. AUC area under the receiver operating characteristic curve, CI confidence interval, CitH3 citrullinated histone H3, PCT procalcitonin, PPV positive predictive value, NPV negative predictive value, SP septic patients, HV healthy volunteers, NIC non-infections disease controls, PIS septic patients with identified infection source, PUIS septic patients with un-identified infection source.

