
Fig 10.
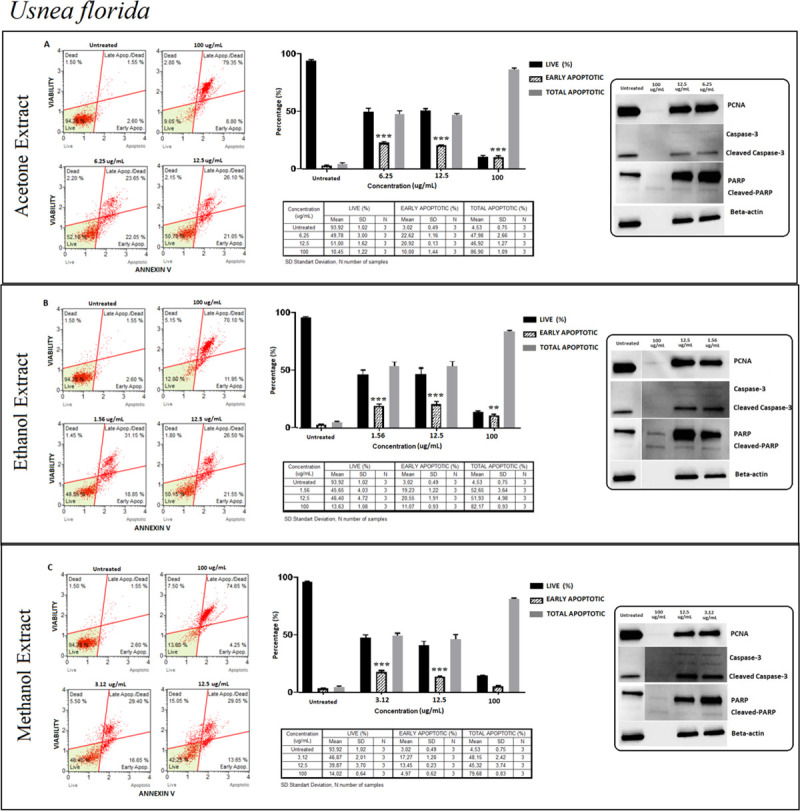
Usnea florida (UF); Annexin V/7’AAD staining flow cytometry results (scatterplots), statistical analysis (bar graphs), ±SD changes between experiments (tables) and protein levels of PCNA, caspase-3 and PARP by western blot (right panel) on PC-3 cells with three different extraction of acetone (results compiled in A), ethanol (results compiled in B) and methanol (results compiled in C) respectively. Annexin V/7’AAD staining by flow cytometry of UF on PC-3 cells was shown to induce apoptotic cell death by mainly early apoptosis. The gating was adjusted according to the untreated sample and the representative scatterplots were presented as the percentage of cells that were viable (Ann-V− and 7-AAD−), early apoptotic (Ann-V+ and 7-AAD−), late apoptotic (Ann-V+ and 7-AAD−), and dead (Ann-V− and 7-AAD+). Scatterplots are shown for untreated, 100 μg/mL, 12.5 μg/mL and 6.25 μg/mL after 48 hours treatment with acetone extract (A) and for ethanol extract treatment, groups are untreated, 100 μg/mL, 12.5 μg/mL and 1.56 μg/mL after 48 hours treatment (B) and for methanol extract treatment, groups are untreated, 100 μg/mL, 12.5 μg/mL and 3.12 μg/mL after 48 hours treatment (C) respectively. The 100 μg/mL concentration is determined as toxic dose for all treatment groups. Results were analyzed and presented as the percentage of three independent experiments of live, early apoptotic and total apoptotic after treatment (bar graphs). Flow cytometry was shown to induce apoptotic cell death by mainly early apoptosis. The significance of only early apoptosis for each concentration indicated with an asterisk and the p value was only presented when the significance level of early apoptosis rate between 0.05 and 0.01. ±SD changes between apoptosis assays were indicated as the mean value and SD changes per concentration and per group of live-early apoptotic-total apoptotic separately (table). Western blot results of proliferating cell marker PCNA and apoptosis-related proteins (right panel) were presented. Dose-dependent PCNA, cleavage of caspase-3 and, PARP respectively. Apoptosis rate seems increased significantly by treatment with specified concentrations by flow cytometry however western blot data showed otherwise, particularly for cleaved-PARP. In addition, the proliferation (PCNA) status remained stable. *p < 0.05, **p < 0.001, ***p < 0.0001 (all p-values were obtained by two-way ANOVA following Dunnet's multiple comparison test).