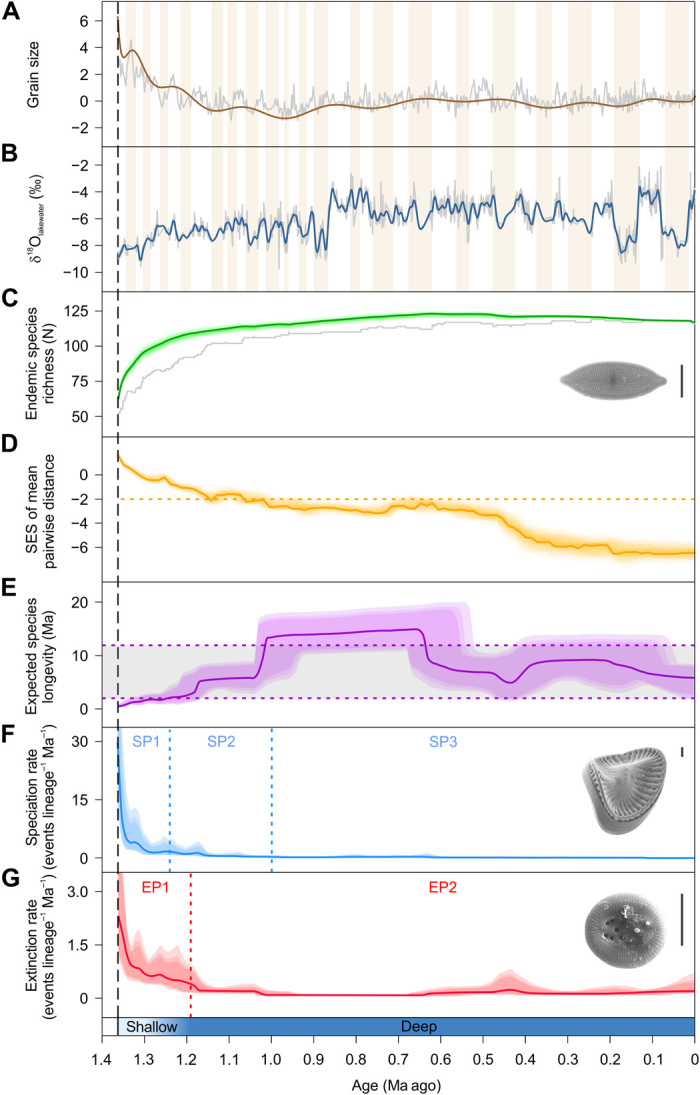
Fig. 2. Climate and environmental indicators and endemic diversity trajectories in Lake Ohrid spanning the past 1.36 Ma.

Black dashed line, time of lake formation; blue bar, lake phases (shallow and deep) (17); brown bars, glacial periods. For a full list of indicators used, see fig. S3. (A) DEEP site grain sizes (summarized by ordination) indicating widening of the lake 1.36 to 1.15 Ma ago. Brown curve, time-averaged data; gray curve, raw data. (B) Lake Ohrid δ18Olakewater values indicating deepening of the lake 1.36 to 1.15 Ma ago. Blue curve, time-averaged data; gray curve, raw data. (C) Lake Ohrid species accumulation curves for endemic diatom species (see also fig. S2). Green species accumulation curve, data corrected for preservation bias; green shading, 95% credible interval; gray curve, raw data (sampled standing diversity). SEM image shows the common endemic species Aneumastus macedonicus. Scale bar, 10 μm. (D) Standardized effect size (SES) of mean pairwise taxonomic distance of all endemic diatom species; values below orange dashed line indicate a significant taxonomic similarity of the community. (E) Estimated mean longevity of endemic diatoms and 95% confidence interval (purple shading), and literature values for the average longevities of the two worldwide freshwater diatom groups with distinct longevities (22) (gray area within the purple dashed lines). (F) Per-lineage speciation rate and 95% confidence interval (blue shading). Blue dashed lines, shifts in speciation rate 1.24 [95% highest probability density (HPD), 1.26 to 1.16] and 1.05 (1.16 to 0.46) Ma ago. SP, speciation rate phases. SEM image shows the extant Scoliodiscus glaber (scale bar, 10 μm), which originated during the early lake phase. (G) Per-lineage extinction rate and 95% confidence interval (red shading). Red dashed line, shift in extinction rate 1.19 (1.26 to 1.16) Ma ago. EP, extinction rate phases. SEM image shows the extinct Cyclotella cavitata. Scale bar, 10 μm.
