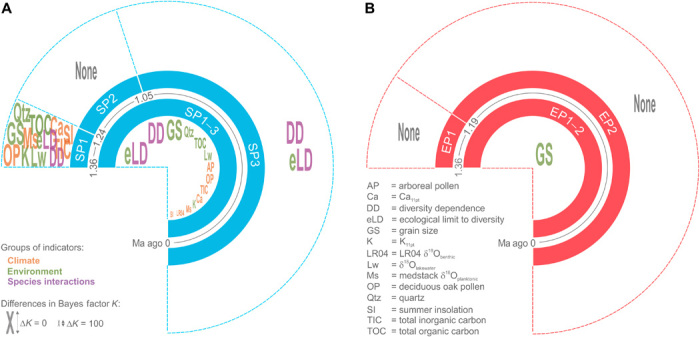
Fig. 3. Summary statistics of the correlation strength of speciation and extinction rates with climate, environmental, and diversity indicators.

Plots summarize the results of the diversification analyses of covariate influence over the entire period of 1.36 Ma and within the three speciation (A) and two extinction rate periods (B). Individual indicators were color coded according to the indicator group. The letter sizes of the indicators correspond to the difference in the Bayes factor K to the best-fit model. For the environmental and climate indicators, both the influence of the change in the parameter and that of the total value were tested; however, only the best is displayed in each case. This also applies to the indicators for the environmentally defined ecological limit to species diversity, where three parameters related to lake size have been tested, but only the best one is shown (for detailed results, see fig. S6). The results show a shift over time from environmental to diversity dependence of the speciation rate (A) and a continued influence of lake size–related parameters on the extinction rate (B).
