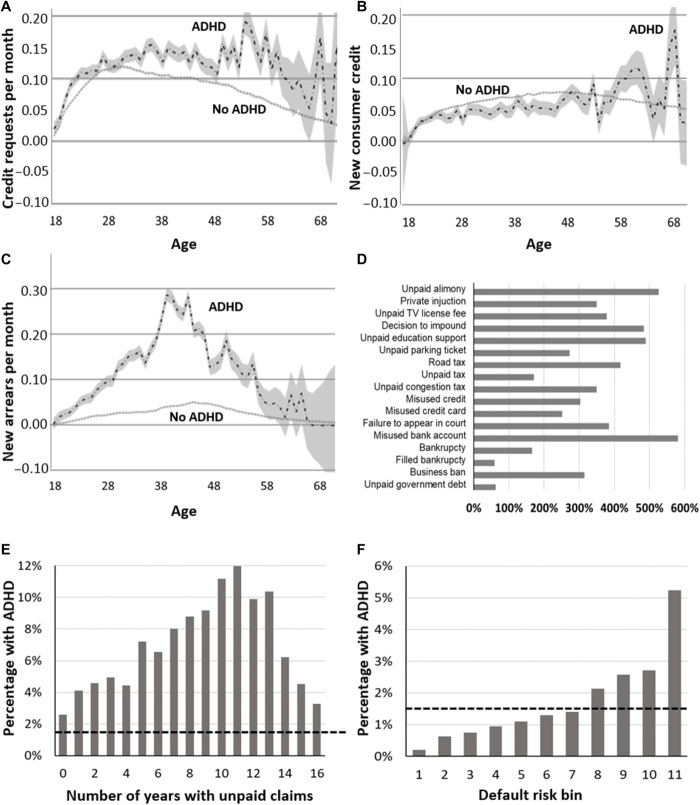
Fig. 2. Associations between ADHD and finances.
Credit and defaults for a random sample of Swedes (17) (n = 1970 ever diagnosed with ADHD; n = 187,297 never diagnosed from 2010 to 2013). (A) Credit requests per month by age. Widening 95% CIs at older ages indicate fewer ADHD cases. (B) New consumer credits per month. (C) New arrears per month. For (A) to (C), y axis values are estimated, adjusting for education, income, sex, psychiatric comorbidities, and physical health. (D) Elevation in arrears for those with ADHD versus the population for everyone registered at the Enforcement Agency in January 2018 (21) (n = 5736 ever diagnosed with ADHD; n = 63,216 never diagnosed). (E) Percentage of people with unpaid claims diagnosed with ADHD by years delinquent. (F) Percentage of people in successive default risk bins diagnosed with ADHD. Increasing x axis scores indicate higher default risk. Proportions of the population and percentage default risk are as follows: bin 1 (0.47; 0 to 0.1%), bin 2 (0.11; 0.1 to 0.2%), bin 3 (0.07; 0.2 to 0.3%), bin 4 (0.05; 0.3 to 0.4%), bin 5 (0.03; 0.4 to 0.5%), bin 6 (0.02; 0.5 to 0.6%), bin 7 (0.05; 0.6 to 0.9%), bin 8 (0.05; 0.9 to 1.4%), bin 9 (0.05; 1.4 to 2.7%), bin 10 (0.05; 2.7 to 30.9%), and bin 11 (0.05; 30.9 to 97.7%). Hatched horizontal lines (E and F) show the population base rate of ADHD.

