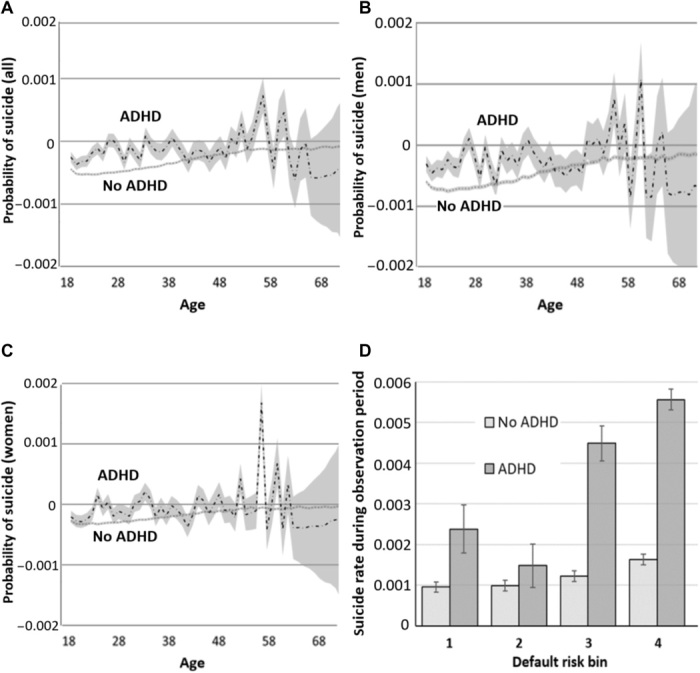
Fig. 4. Suicide outcomes by ADHD status.

(A) Probability of suicide during the observation period for all people with ADHD and without ADHD. (B) Probability of suicide for men diagnosed with ADHD versus without ADHD. (C) Probability of suicide for women with ADHD versus without ADHD. For (A) to (C), y axis values are estimated, adjusting for education, income, sex, psychiatric comorbidities, and physical health. No differences were found between men and women. Data are from the full Swedish population from 2002 to 2015 (n = 177,336 ever diagnosed with ADHD; n = 11,371,854 never diagnosed with ADHD) (15). Widening CIs above age 60 result from fewer ADHD cases. (D) Disparities in suicide rates for those with and without ADHD by default risk. Data are from a random sample of Swedes (17), collected between 2010 and 2013 (n = 1970 ever diagnosed with ADHD; n = 187,297 never diagnosed with ADHD). Increasing scores along the x axis indicate higher likelihood of default. We collapsed into four default risk bins to obtain stable estimates of suicide, given comparatively low base rates. Proportions of the population and percentage default risk are as follows: bin 1 (0.47; 0 to 0.1%), bin 2 (0.18; 0.1 to 0.3%), bin 3 (0.15; 0.3 to 0.9%), and bin 4 (0.20; 0.9 to 97.7%).
